Guest Post from Wolf Richter at WolfStreet.com:
It’s just not encouraging at all. Inflation is just shifting around, dropping in some product categories, rising in others.
Prices of energy goods and services that consumers buy plunged in March from February, and have been dropping for months, according to the PCE price index data from the Bureau of Economic Analysis today. Food prices dipped in March from February for the first time, after months of slowing price increases following the huge price spike through mid-2022. Durable goods prices dipped but barely, and at the lowest rate in months; they appear to be bottoming out. And prices of services rose. And much of the month-ago released PCE price index data for February was revised higher today.
It boils down to this: Core PCE price index is stuck and stubbornly high, as inflation churns from one product category to another.
The “core” PCE price index is the yardstick for the Fed’s inflation target. Its the PCE price index without food and energy products. On a year-over-year basis, it jumped by 4.6%, same as in December and July 2022, nine months ago! The Fed’s inflation target is 2%, and it uses this core PCE index as yardstick. But core PCE has been going sideways at just under 5% for months.
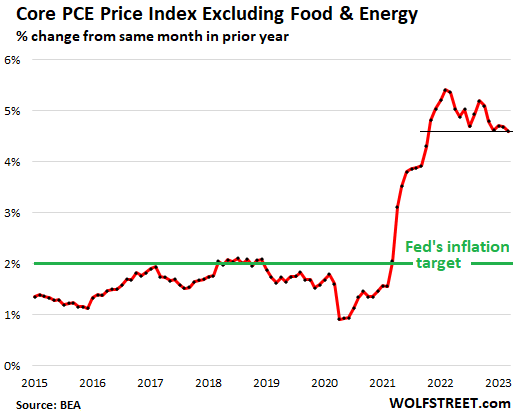
A month ago, the BEA reported the February core PCE increase as having risen by 4.6%. Today this was revised up to a 4.7% increase.
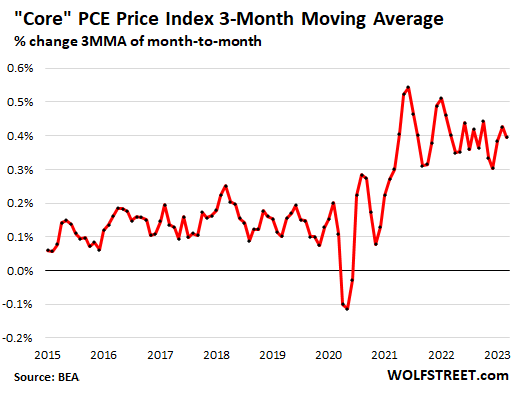
How the core PCE price index has remained in the same high range can be seen in the month-to-month movements, which have been jumping up and down in the same range since 2021, where a couple of drops were followed by another jump or two.
The three-month moving average smoothens out the month-to-month ups and downs of the core PCE and shows the trends more clearly. It’s just not encouraging at all. It shows that underlying inflation is stubbornly entrenched, shifting around, dropping in some product categories while rising in others.
This is just not encouraging at all:
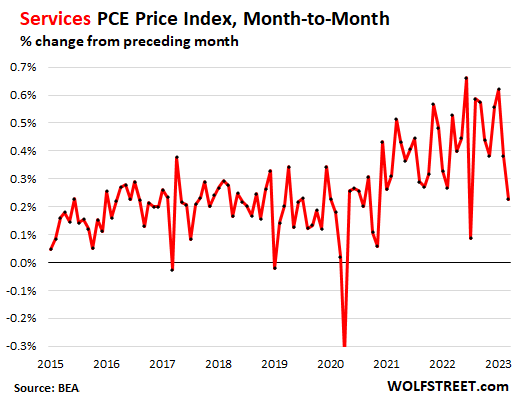
Inflation in services.
Services is where the majority of consumer spending ends up. Services matter. They include healthcare, housing, utilities, education, travel, entertainment, restaurant meals, streaming, subscriptions, broadband, cellphone services, etc. Inflation is particularly difficult to wring out of services.
The PCE price index for services jumped by 5.5% year-over-year in March, compared to the upwardly revised 5.8% in February, which had been the worst since 1984:
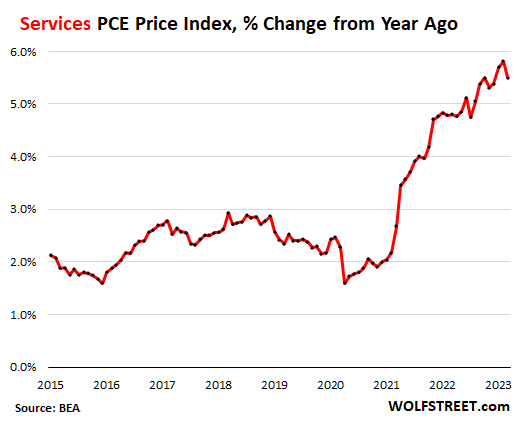
On a month-to-month basis, the PCE price index for services rose by 0.2% in March from February. Services here includes household energy services, such as gas and electricity, which plunged (especially natural gas) from February.
There had been a similar only bigger outlier in July 2022 that then promptly reversed the following month:
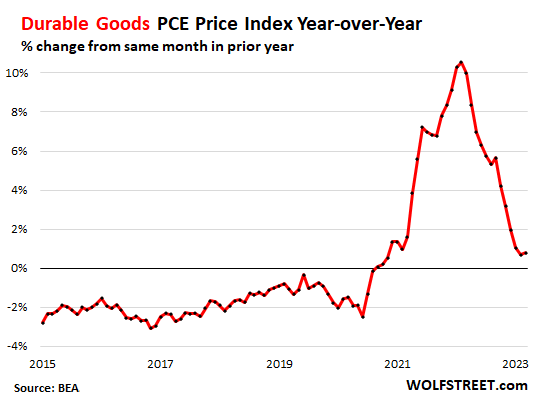
Durable goods prices.
The PCE price index for durable goods – new and used vehicles, appliances, furniture, etc. – dipped by 0.1% in March from February, the smallest decline in months, as price declines are fading. Year-over-year, durable goods inflation was 0.8%:
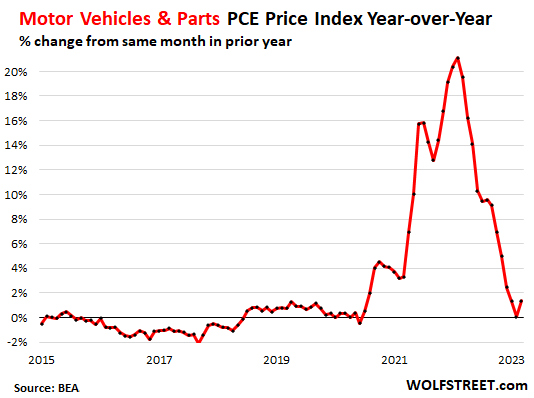
Motor vehicles and parts were flat month to month for the first time after five months of drops. This caused the price index, on a year-over-year basis to bounce off the 0%-line.
The price drops in used vehicles have been a big factor in pushing down durable goods prices and the core PCE priced index. But it looks like that factor is somewhat fading – another sign of how inflation is shifting from one product category to another:
The PCE price index for gasoline and other energy goods plunged by 4.6% in March from February and by 20% year-over-year.
The PCE price index for food fell by 0.2% in March from February, which pushed down the year-over-year increase further, to 8.0%, the least terrible year-over-year increase since February 2022.
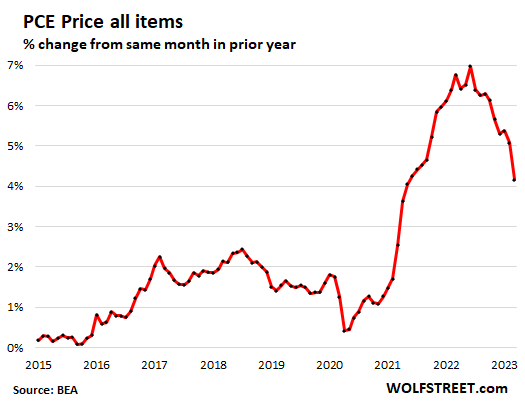
The overall PCE price index rose by 4.2% year-over-year, the slowest rate since May 2021, pushed down by plunging energy prices and by some durable goods prices, but pushed up by services prices: