Where does the money come from? They now out-earn inflation, they earn interest income, and they dipped into their assets whose prices ballooned over the years.
Consumer spending, adjusted for inflation and for seasonal factors jumped by 0.5% in April from March, after two months of declines and a huge spike in January.
Compared to a year ago, adjusted for inflation, consumer spending rose by a solid 2.3%, in line with the average growth rate in 2019 (2.4%). Americans continue to do what they do best: spending money, and they’re outspending inflation just fine.
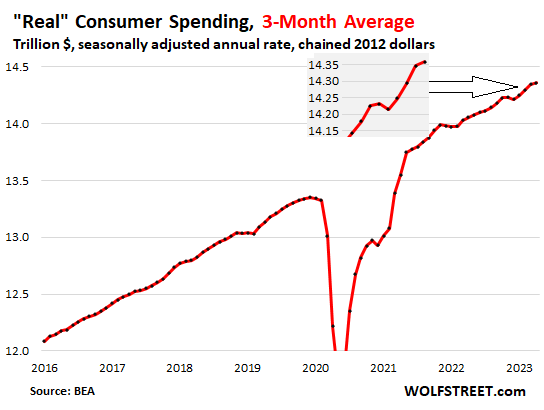
To tamp down on the month-to-month zigzags and see the trend, we look at the three-month moving average of inflation-adjusted, aka “real,” consumer spending: It has been on a normal-ish Good-Times uptrend: Despite getting whacked by inflation, high interest rates, a credit crunch, layoff news, and bank turmoil, consumers picked up the pace so far this year, after the little slowdown late last year that you can see in the chart:
Now they out-earn inflation. Adjusted for inflation, aka “real” personal income rose by 0.2% in April from March and by 1.2% year-over-year, the biggest year-over-year increase in 13 months.
This “real” income is from all sources – including interest and dividend income and rental income – but excluding transfer payments (Social Security, unemployment insurance, etc.).
They got the biggest pay increases in decades. And they hold trillions of dollars of CDs, Treasury bills, and money-market funds, which now earn 5% and more, instead of 0.2% two years ago. And this sudden surge of interest income pushes up their overall income.
You can see how inflation outran personal income for much of 2022 and into early this year, and “real” income declined for that time. But over the past two months, “real” incomes rose again, and hit a new record in April:
![]()
They did mostly not borrow this money on their credit cards.
They spent bit and pieces of their massive asset gains. Real incomes without transfer payments (+1.2% year-over-year) rose more slowly than real spending (+2.3%). Most of the difference is drawn from the wealth in assets that Americans have, especially the big spenders that move the spending needle.
Capital gains, asset sales, and the cash flow from maturing CDs and bonds are not included in the income figures here. Pulling money out of brokerage accounts to spend on furniture or a trip is not included in the income figures either. Over the past decade, those asset accounts have ballooned with surging asset prices, and people are drawing on them. This is particularly the case for the large number of retirees.
It is nonsense to assume that when spending exceeds incomes, that this is borrowed money, that people are incurring more consumer debt to spend this money (though a few people do). In aggregate, people aren’t even dipping into their “savings” in the narrow sense. They’re using the gains on their assets, and those gains don’t show up in the income figures; but spending even a small portion of those gains does show up in the spending figures.
They used their credit cards mostly as payment method, not as borrowing method. Over the past 12 months, the rate of consumer spending in nominal terms, so not adjusted for inflation, increased by $1.15 trillion. In April, consumers spent at an annual rate of $18.3 trillion. These are huge numbers!
Over the same period, balances of credit cards and other revolving credit increased by only $153 billion, and a big portion of that increase is paid off on due date the next month and never incurs interest, though it does show up in the balances of the prior month.
Americans run about $5 trillion a year in spending through their credit cards as payment method, collect the 1% or 2% cash-back or get the mileage credit or whatever, and the majority of them pay off those balances every month and never pay interest on them.
And spending that is run through credit cards has surged this year, particularly on travels and “experiences” – experiences such as Taylor Swift concert tickets purchased from corporate scalpers for thousands of dollars each. The WSJ had a piece on that. Like drunken sailors.
The travel surge was confirmed by card companies, including AmEx. Practically all of this spending on travels and experiences is paid for via cards. Yet in Q1, credit card balances as a percent of disposable income actually dropped, thanks to surging incomes and thanks to the fact that the majority of cardholders are paying off their cards every month. We discussed credit cards in detail here.
Spending by category, adjusted for inflation.
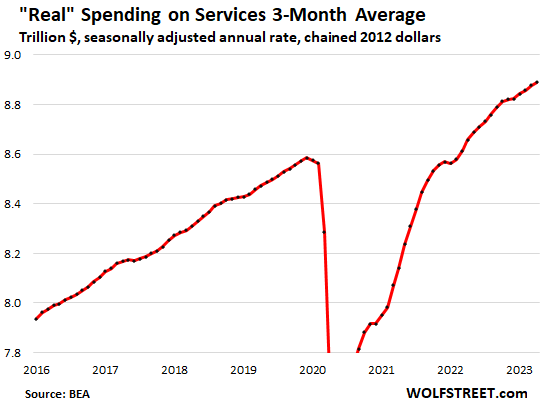
Spending on services, adjusted for inflation, rose by 0.3% for the month and by 2.7% year-over-year, exceeding the five-year average growth in 2015-2019 of 2.3%, driven in part by the surge in spending on travels and experiences.
Services accounted for 61.9% of total consumer spending in April. In addition to the Taylor Swift tickets, it includes housing, utilities, insurance of all kinds, healthcare, travel bookings, streaming, subscriptions, repairs, cleaning services, haircuts, etc.
To smoothen out the month-to-month zigzags and show the trend, here is the three-month moving average. Note the near-flat spot late last year, and the resurging growth this year, all adjusted for inflation:
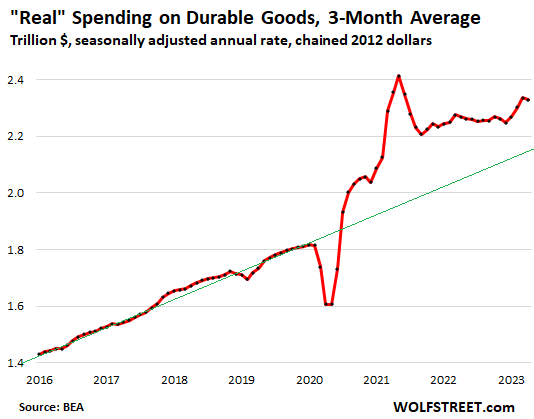
Spending on durable goods, adjusted for inflation, jumped by 1.4% in April from March, after two months of declines, and was up by 2.6% year-over-year. This includes new and used vehicles, appliances, furniture, electronics, tools, etc.
The three-month moving average in April shows the combination of the February and March dips and the April increase. The three-month average was also up 2.6% from a year ago. It is just astonishing that Americans, after the huge surge during the stimulus phase, are still buying durable goods at a rate that is substantially above the pre-pandemic trend (green line):
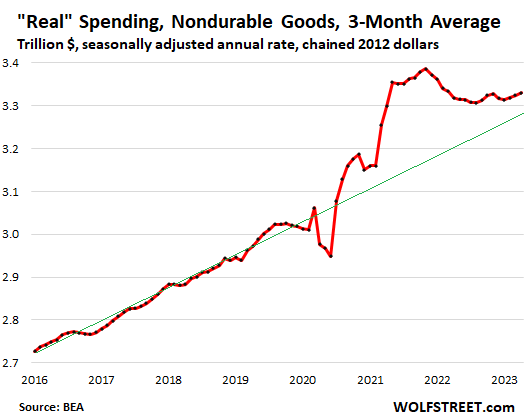
Spending on nondurable goods, adjusted for inflation, jumped by 0.4% for the month, but year-over-year was up only 0.8%. This includes food, fuel, clothes, shoes, and supplies. The three-month moving average is still well above the pre-pandemic trend:
Not even the banking turmoil and “credit crunch” or whatever slowed them down.
April was the first month that reflected consumer spending during the banking turmoil that started in mid-March, which was supposed to trigger tighter credit conditions – the “credit crunch”—that would slow down consumer spending, that’s what Fed officials from Powell on down have suggested.
But that hasn’t happened. Consumers are in no mood to slow down, they’re making more money from their labor, and they’re earning more in interest on CDs, money market funds, savings accounts, and Treasury bills – 5% instead of 0.2% two years ago. And they’re spending this money. And they’re spending some of their assets gains from the past 10 years.
And the tighter credit conditions, if any, haven’t slowed them down at all. Though they loathe this inflation, they have gotten used to it, and you live only once, and this inflation is now part of it, and spending must go on, come heck or high water in form of inflation, high borrowing costs, the credit crunch, endless layoff announcements, and the banking turmoil.
Inevitably, with consumers pushing this hard, inflation re-accelerated, as measured by the Fed’s favored core PCE price index, amid re-accelerating services inflation and suddenly jumping motor vehicle prices.
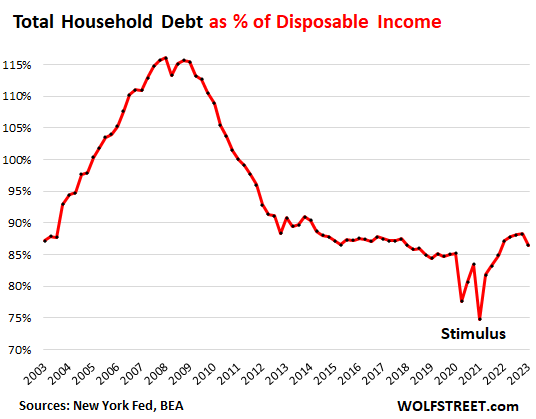
Not racking up debt in relationship to income.
And just for those who’re concerned about households racking up debt they cannot afford, here is total household debt as a percentage of household disposable income, based on data from the New York Fed. It includes housing debt. Note the dip at the end; it occurred because total household debt inched up 0.9% in Q1 from Q4, but disposable income (income minus payroll taxes) jumped by 3.0% — both in nominal terms: