
Originally posted by Crescat Capital:

A Profusion of Recession Indicators
Despite the growing popularity of the soft-landing narrative, the current scenario presents a multitude of macro factors forewarning a major recession. The dangerous disconnect of highly inflated valuations of financial assets within a market environment substantially different from the easy money conditions of the past few decades defies logic. With the US economy teetering on the brink of a downturn, the broader equity market is now at risk of a violent selloff and a significant compression of fundamental multiples.
Crescat’s macro model, encompassing 17 macro, fundamental, and technical indicators, is now at one of its most alarming levels in the data record. It’s worth noting that this model has proven highly effective in identifying pivotal shifts in the US business cycle, which inherently oscillates between expansion and contraction in tandem with fluctuations in asset valuations and credit availability. Presently, nearly all indicators have reached historic extremes, corroborating our perspective on the high risk of an impending hard landing.
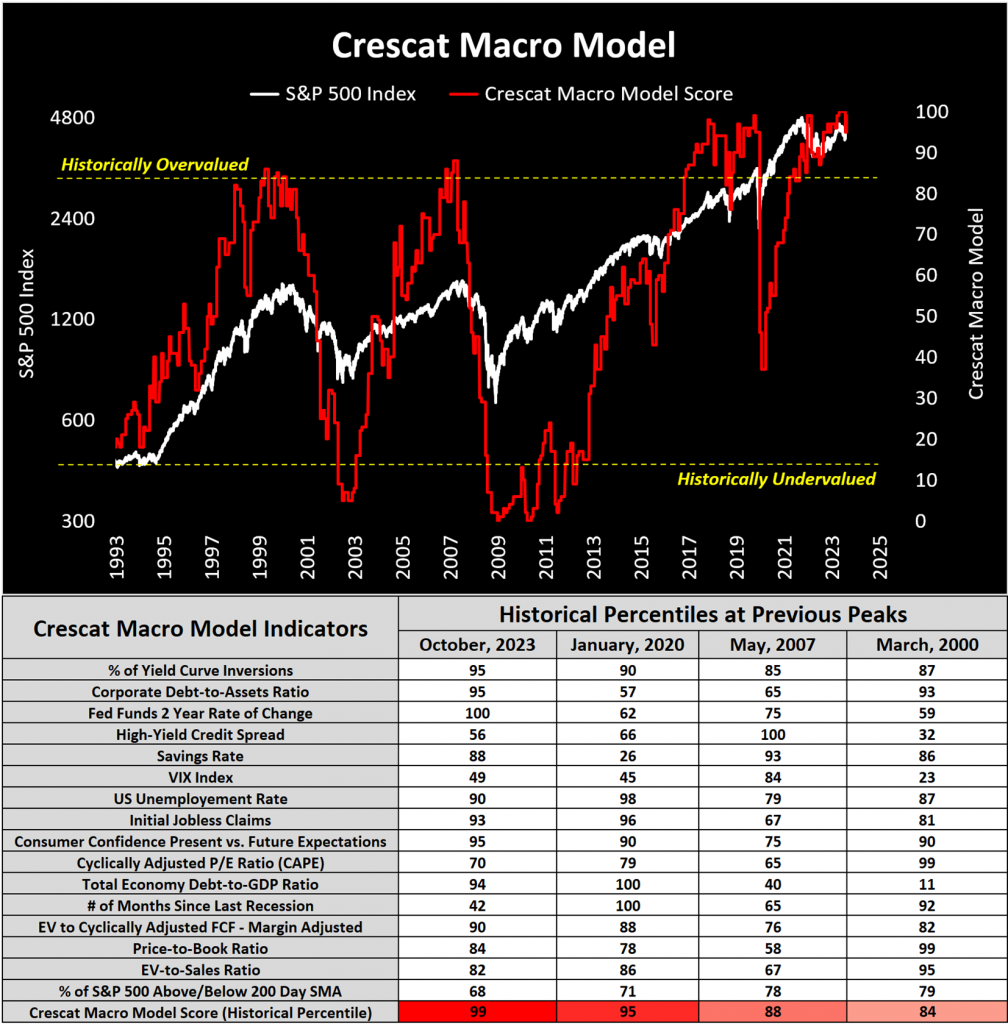
We currently stand at a crucial juncture in financial markets and the global economy, supported by an extensive list of compelling macro reasons:
- Global central bank assets are contracting and significantly deviating from overall stock trends.
- Yield curve inversions are steepening after being extensively inverted, a classic signal in credit markets that typically coincides with the onset of an economic decline.
- The unemployment rate has surpassed its 2-year moving average, an indicator that has consistently foreshadowed a recession over the last 50 years.
- Every time the ISM manufacturing index remained below the key 50 level for 12 consecutive months, a recession ensued.
- Household saving rates are nearing historic lows.
- The Conference Board Leading indicator has declined for 19 consecutive months, a trend observed only during the Stagflationary recession of 1973-4 and the Global Financial Crisis.
- Market leadership has narrowed with technology mega-cap stocks isolated from the rest of the market, reminiscent of the times preceding the 2001 Tech Bust.
- The recent enormous value destruction in fixed-income assets worldwide
- The perilous divergence between falling Treasury prices and the Nasdaq 100 Index, which continues to defy gravity in a markedly higher cost of capital environment.
- Typical late-cycle valuations among equity markets are historically overblown across several fundamental multiples: price-to-book, price-to-free cash flow, price-to-sales, cyclically adjusted price-to-earnings, overall market cap of US stocks relative to GDP, and others.
- Monetary policy operates with a lag and the Fed has been in a rate hike cycle for 21 months and 20 months into quantitative tightening.
- Banking credit is starting to contract, reaching levels only experienced during the Global Financial Crisis.
- An aggregate index of cyclical industries such as banks, retail, homebuilders, autos, and small caps is now down 20% relative to the S&P 500.
- Trucking employment is contracting at a faster rate than it did during the 2000 and 2008 cycles.
- Consumer sentiment, in terms of present situation versus future expectations, is currently near record levels, serving as an incredibly reliable contrarian indicator.
- Federal tax receipts have declined for seven consecutive months, a sequence only observed during recessions.
- An overwhelming amount of corporate and sovereign debt obligations are maturing in the next 12 months, with effective interest rates on the verge of a drastic rise from historically low levels.
- Corporate margins are yet to feel pressure from rising wage increases as the cost of living remains high and labor strikes continue to unfold.
- Less than one-third of all small-cap stocks in the US have turned a profit in the last three years.
- Aggregate corporate earnings currently reside at the upper boundary of a 70-year channel, historically marking a critical juncture with profits declining significantly in the subsequent years.
- Warren Buffett has made a strategic move to accumulate the largest cash position in Berkshire Hathaway’s history, comprising 52% of cash relative to total assets.
Please refer to the appendix of this letter for supplementary charts that substantiate these key points.
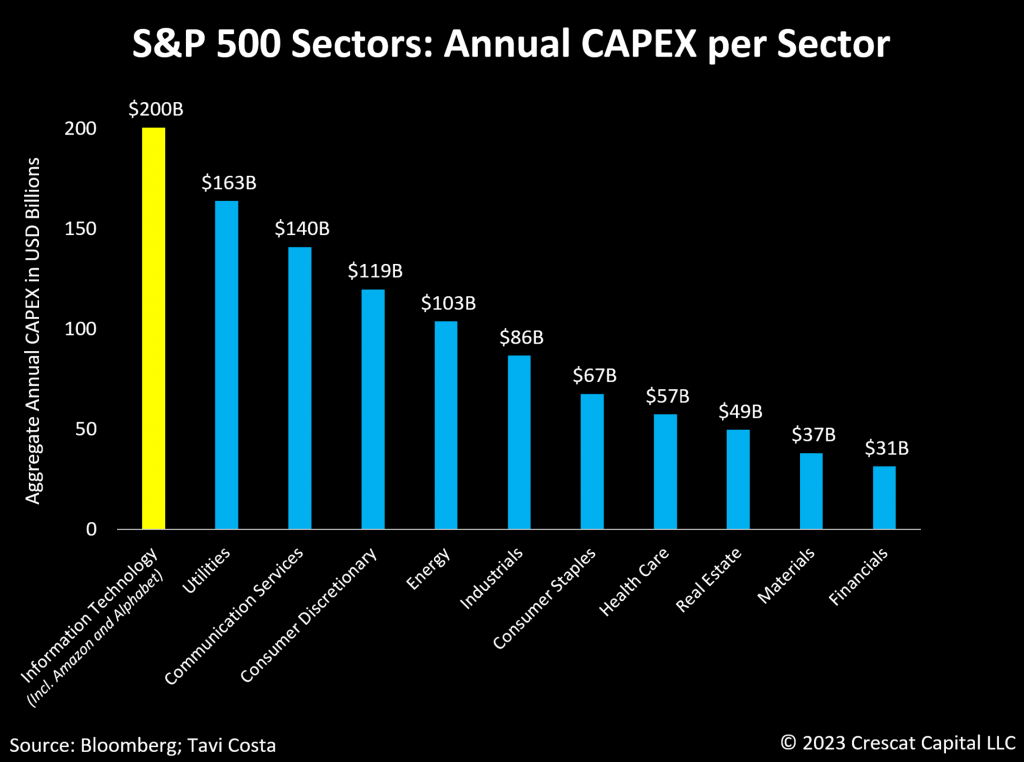
Tech Companies Are the Most Capital-Intensive Sector in the Economy Today
While it has been relatively unnoticed, US companies have recently engaged in one of the most extensive capital spending booms in history. Conventional wisdom would think that most of these corporate investments in the economy are currently being driven by highly capital-intensive businesses, but the truth is that technology businesses have been by far the biggest contributor to this investment expansion. Megacap technology companies currently carry most of the weight in the economy and have been prominent players in the capital expenditure witnessed over the past 12 months. Nonetheless, their growth potential is nearing a point of exhaustion, making it increasingly crucial for them to reinvent themselves and explore alternative avenues to expand their businesses. However, the challenge lies in the fact that, despite investing billions of dollars in artificial intelligence (AI), these expenditures have only resulted in marginal improvements in their revenues.
The Goldilocks era where technology companies could sustain high earnings and free cash flow growth with minimal capital investment is gone. To put this in historical context, the current real growth in earnings in the decade-to-date is already the second largest in history, closely trailing the prior decade’s performance. Apart from the 2010s, the only two instances of notable long-term increases in profits occurred in the 1920s and the 1990s, both preceding severe earnings recessions. We believe the 2010s will mark the pinnacle of corporate-profit growth for any calendar decade in history and for many to come. The 2020s-to-date growth is entirely unsustainable. Nominal earnings are poised to turn negative over the next year, and real earnings are likely to remain negative for much of the rest of the decade due to structural inflationary factors.
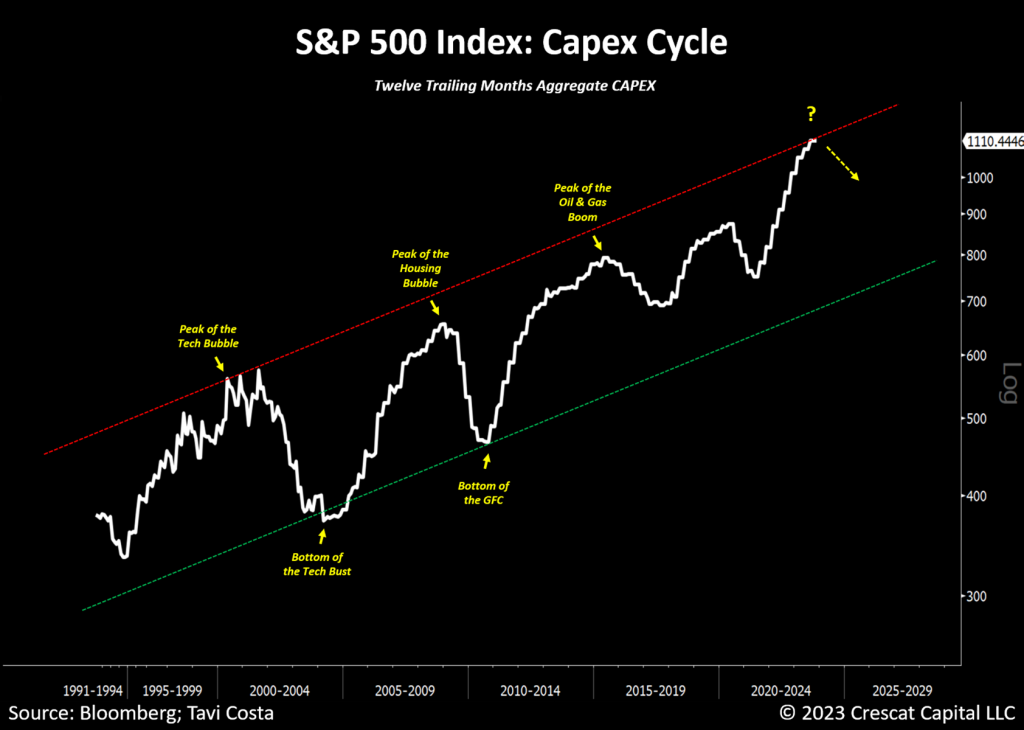
CAPEX at the Apex
It’s important to note that the aggregate capital expenditure cycle of S&P 500 index members typically follows an upward trend, and we currently find ourselves at the upper limit of this range, likely at a pivotal juncture that often signifies the onset of a contraction in capital expenditure.
A similar situation occurred at the peaks of the Tech Bubble in 2000, the Housing Bubble in 2007, and the Oil and Gas Boom in 2014. Considering the increased leverage of corporations today, we believe it’s only a matter of time before most U.S. businesses are compelled to scale back their investment plans as an integral part of the unfolding downturn in the economic cycle.
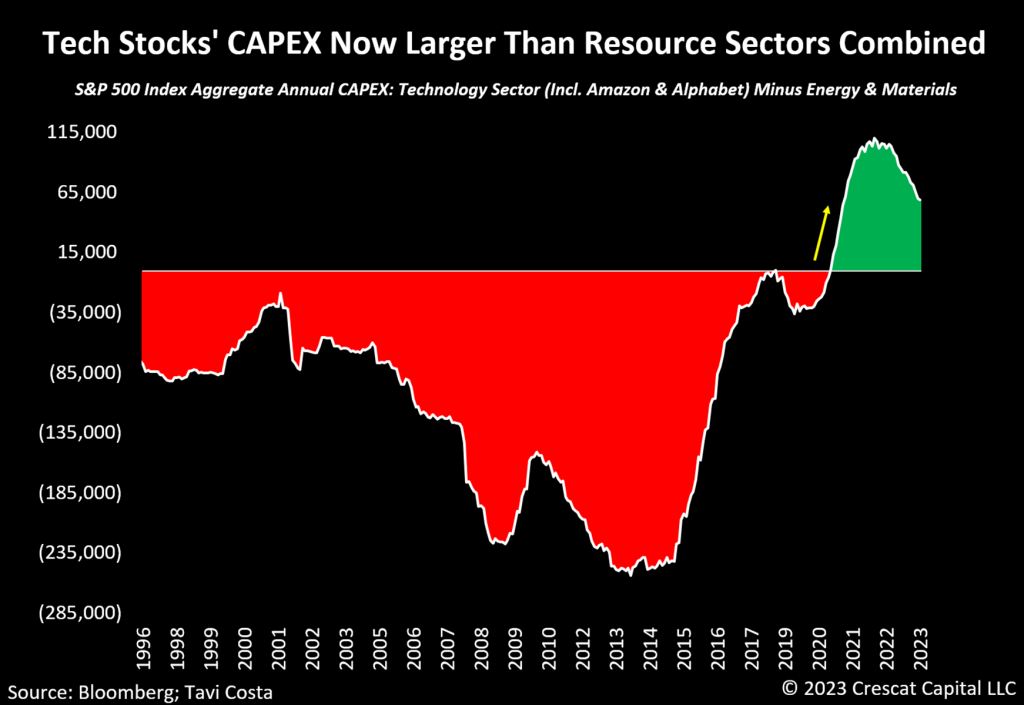
Tech Capex Alone Is Now Higher Than Resource Sectors
In an unprecedented shift, AI and other technological advancements now require more capital investment than sectors traditionally associated with natural resources. To be precise, the S&P 500 tech companies, such as Amazon and Alphabet, collectively allocate a higher annual capital expenditure than the combined spending of the energy and materials sectors.
The ongoing need for significant capital infusion by tech companies, particularly as they approach a growth ceiling in their current operations, fundamentally positions these enterprises as more cyclical in nature.
The reality is that technology companies are increasingly taking on the reputation of being more capital-intensive compared to resource companies. While it is crucial to emphasize the growing lack of capital prudence in the tech sector, our analysis shows that the overly cautious approach by commodity businesses in contrast is signaling the beginning of some remarkable long-term investment opportunities in the resource sectors.
To elaborate further, extended periods of excessive spending and misallocation of assets are typically followed by challenging phases characterized by restricted capital access. In response, management teams of resource businesses adopt a more conservative strategy, resulting in historically low capital expenditure and notable supply constraints. These phases offer enduring investment opportunities in commodities, and it seems we are currently in the early stages of this trend.
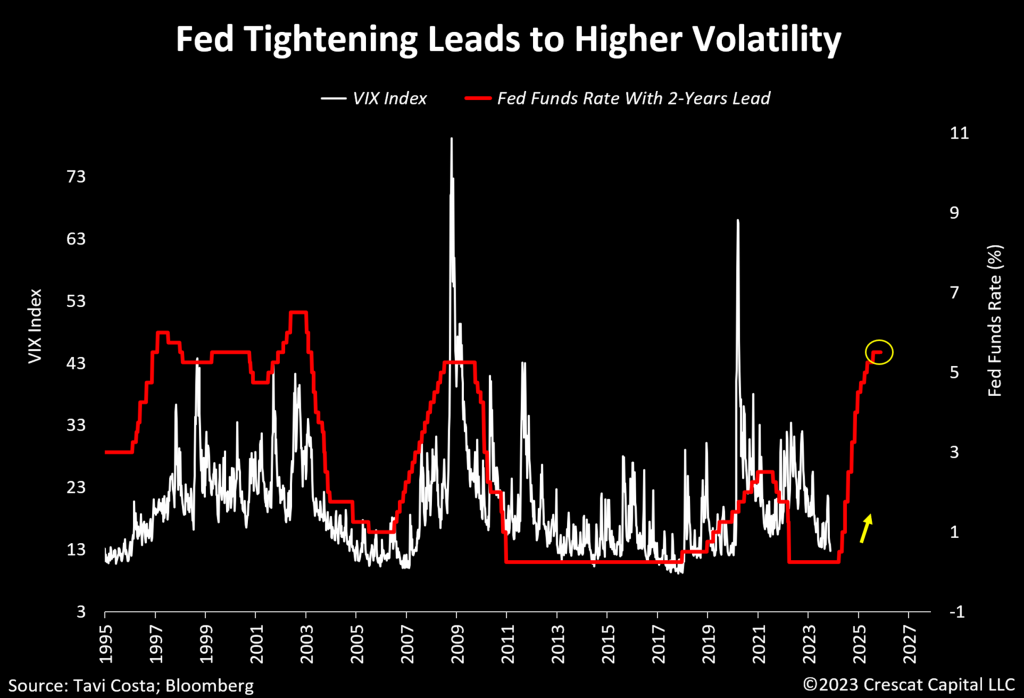
Volatility Is Poised to Rise
Throughout history, we have repeatedly witnessed the time-delayed effects of monetary policy, and this pattern holds true today, especially considering the circumstances. The upcoming year will see a significant wave of maturing debt obligations for sovereign institutions, corporations, and even individuals. The US Federal debt alone is poised to have almost one-third of its Treasuries outstanding—amounting to $8.2 trillion—mature in the next 12 months. To put this into perspective, it’s over 3.5 times the net issuances observed so far this year. Consequently, we anticipate a substantial rise in effective interest rates in 2024, leading to highly restrictive financial conditions.
The chart below provides additional insight into the delayed impact of monetary policy on market volatility, measured in this case by the VIX index. With a 2-year lead, changes in Fed funds rates have often foreshadowed significant volatility events in equity markets. The current narrowing leadership in the stock market, coupled with numerous recession indicators sounding alarms, supports the argument that volatility is currently unsustainably suppressed.
As value-driven money managers, our constant pursuit is to identify both undervalued and overvalued assets. Given our strong macro views, the current suppressed levels of equity volatility align with our short investment thesis on many popular large-cap equity names. As part of our Global Macro and Long Short funds, we are currently expressing this perspective through put options in a selection of overvalued and fundamentally deteriorating businesses identified by our fundamental models ahead of what we believe is a looming macroeconomic downturn.
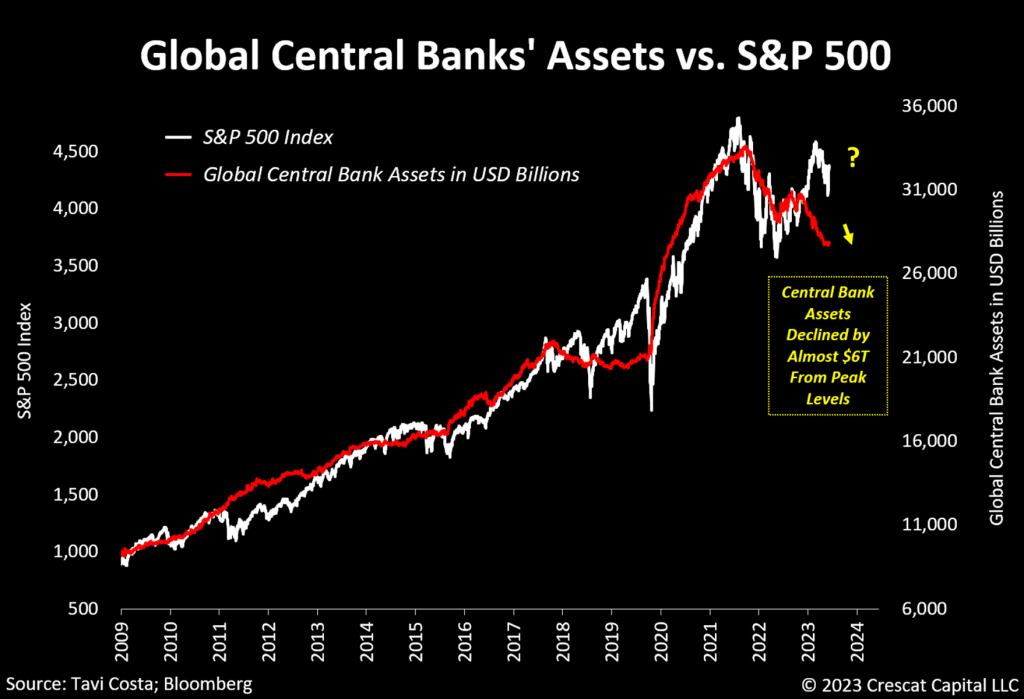
A Major Liquidity Withdrawal
Global central banks’ assets have already declined by almost $6 trillion from peak levels. To be clear, that does not include any mark-to-market losses from the recent collapse in prices of sovereign bonds worldwide. Undeniably, this is a major liquidity withdrawal from financial markets. More interestingly, the chart below shows the historical correlation between the aggregate size of central banks’ balance sheets and the performance of US equity markets. We have recently noticed an important divergence in these two metrics, which in our strong views indicates that the overall equity market has significant downside potential from their current prices.
Despite the prevalent belief that the recent stock rally signifies the start of a new bull market, we align ourselves with a historical perspective that quantitative tightening is significantly draining liquidity from the system, and the economy is still on track for a hard landing.
It is worth noting that although technology stocks, particularly mega-cap companies, have carried most of the market gains so far this year, the year-to-date performance of eight out of eleven sectors is currently negative.
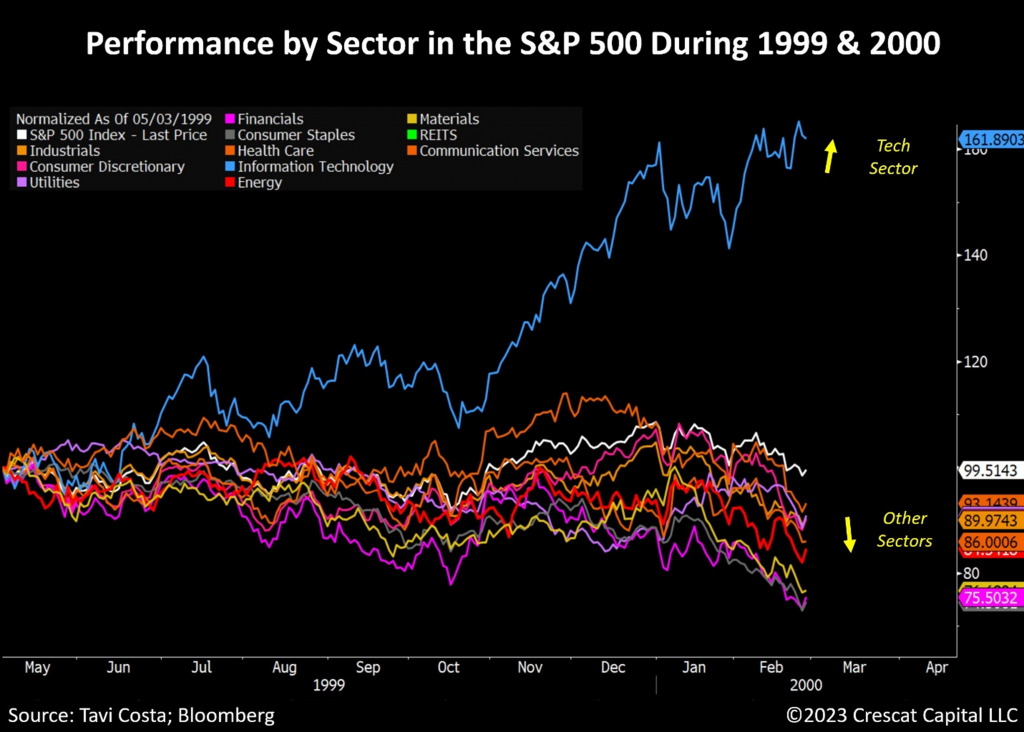
Narrowing Leadership Similar to the Peak of the Tech Bubble
In terms of market leadership and breadth analysis, observe the striking resemblance between the period from mid-1999 to the peak of the tech bubble in US equity markets and the current scenario. Back then, technology was leading strongly, while all 10 other sectors were already in negative territory.
The current market’s overall lack of strength raises concerns, signaling weakness and fragility in the system. While most businesses are already undergoing reevaluation at lower multiples, technology companies remain historically overvalued.
Notably, the technology sector’s aggregate market cap now represents 25% of today’s GDP, compared to 22% during the peak of the tech bubble in March 2000. In contrast, tech companies’ current profits make up only 1% of the size of the economy.
We find it highly unlikely for these companies to continue leading the market into 2024, especially given current interest rates. There’s a substantial risk of investors discounting these businesses at significantly lower present values, as fundamental growth appears to be limited relative to current estimates.
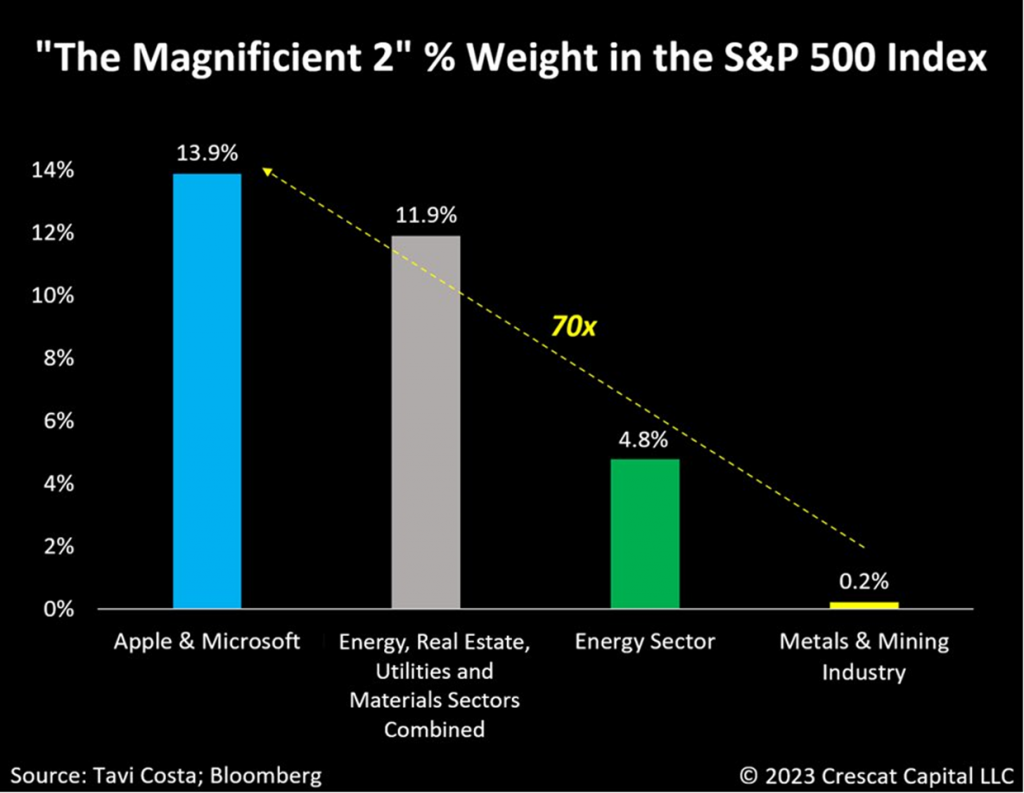
Two Companies Now Larger Than 4 Sector Combined
It’s mind-boggling that Apple and Microsoft’s weight alone in the S&P 500 is larger than four sectors combined, and, more importantly, both companies are 70x larger than the entire metals and mining industry.
For us, that’s a reflection of how distressed miners have become. During inflationary regimes, one must strive to find companies with purchasing power to navigate these types of environments. Resource companies, despite facing increased operating costs, have inherent pricing power in their businesses as underlying commodity prices tend to perform exceptionally well during such periods.
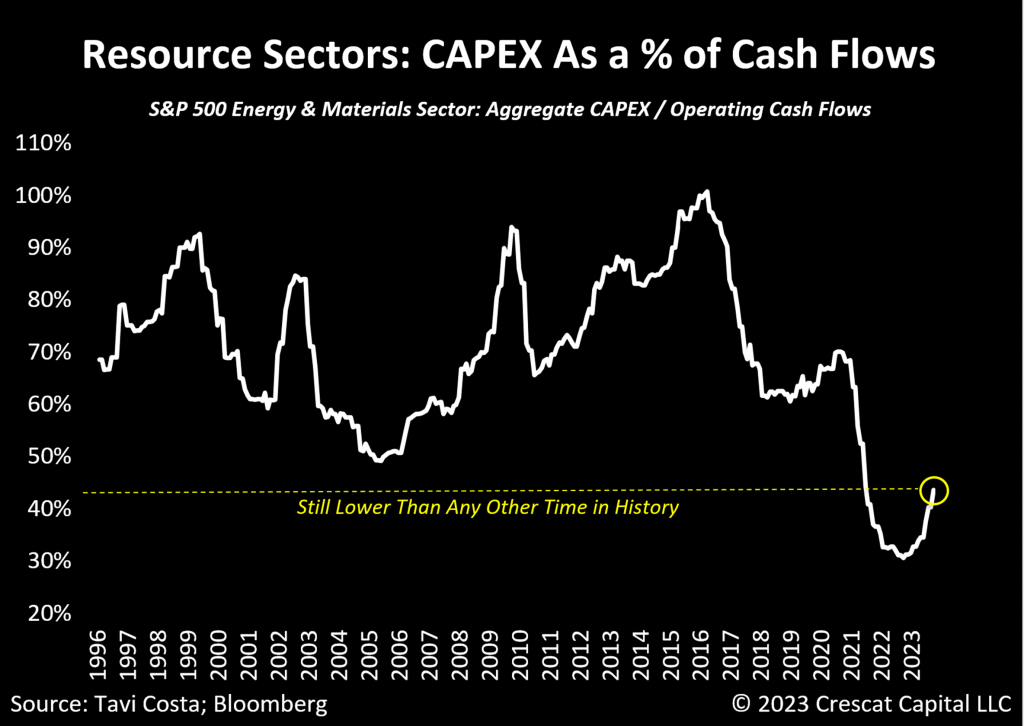
Capital Conservatism
The chart presented below effectively illustrates the historical conservatism of resource companies in terms of capital management. Examining their capex in relation to operating cash flows reveals that they allocate only 40% of their generated profits toward capital expenditure. This level is among the lowest in history, significantly below its previous lows in the mid-2000s during the bull market for commodities.
An Allocation Shift Towards Gold
From our perspective, precious metals and mining companies remain among the most appealing investment opportunities, with gold poised for a significant breakout that could signal the initiation of a new long-term cycle. There is nothing that adds more fuel to the fire of precious metals than being forced to restore financial repression in a highly inflationary environment. Interestingly, for the first time since 2021, central banks worldwide are implementing more rate cuts than hikes.
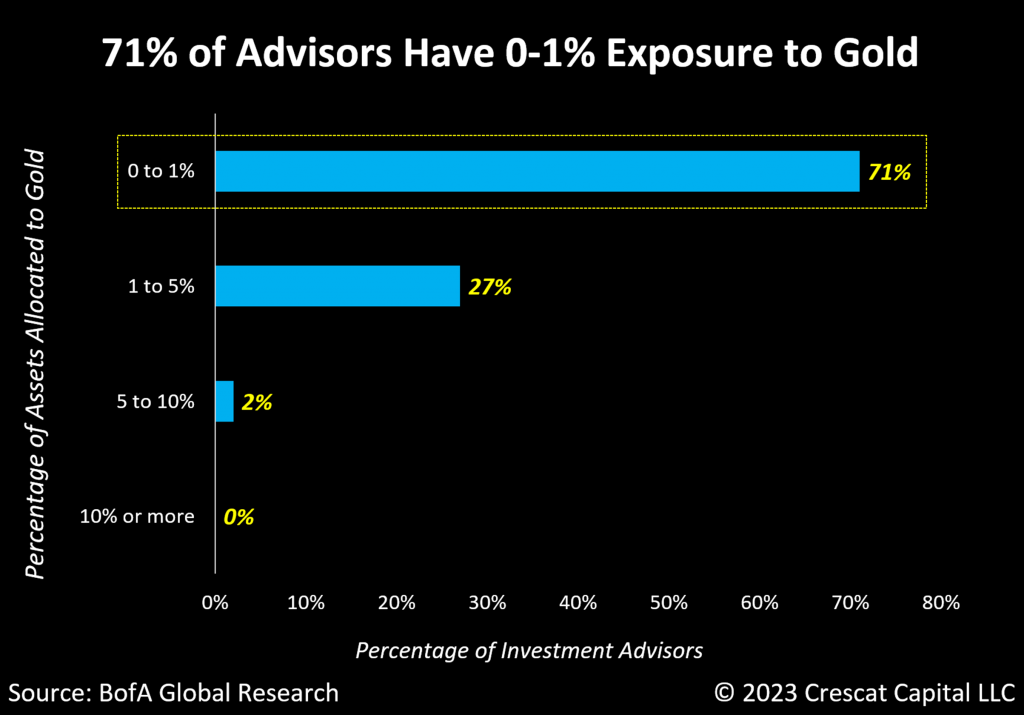
The macro reasons for owning gold are undeniably strong, and what further reinforces our confidence is the consistent neglect of the metal as a defensive alternative over the past few decades. This is evident in the significant underrepresentation of precious metals among traditional investment strategists. According to Bank of America, 71% of wealth advisors hold 0-1% of gold in their portfolios today.
What stands out to us even more from the data below is the notable absence of any investors who own 10% or more of the metal— to say the least, a striking observation.
Furthermore, over the past three to four decades, central banks have entirely disregarded precious metals. In 1980, gold constituted 75% of global central bank assets, whereas now it accounts for less than 20%. There has been a recent shift in this pattern, with certain central banks reporting notable acquisitions of the metal. However, we still have a long way to go before reaching historical allocation-size standards.
If traditional investment strategies and central banks undergo a substantial shift towards the metal, it could likely represent one of the most compelling investment opportunities in gold to date. There is an unmistakable peculiarity in the behavior of precious metals. Even with positive developments on the war front, gold continues to showcase impressive performance. A lesson from the markets is that it is consistently bullish when assets rally in response to news that would typically prompt selling pressure. In essence, it appears that a significant accumulation of the metal is taking place behind the scenes.
Keep in mind that the strong potential for a secular bull market in precious metals makes me particularly excited about silver, which remains at a historically elevated gold-to-silver ratio, at 83.
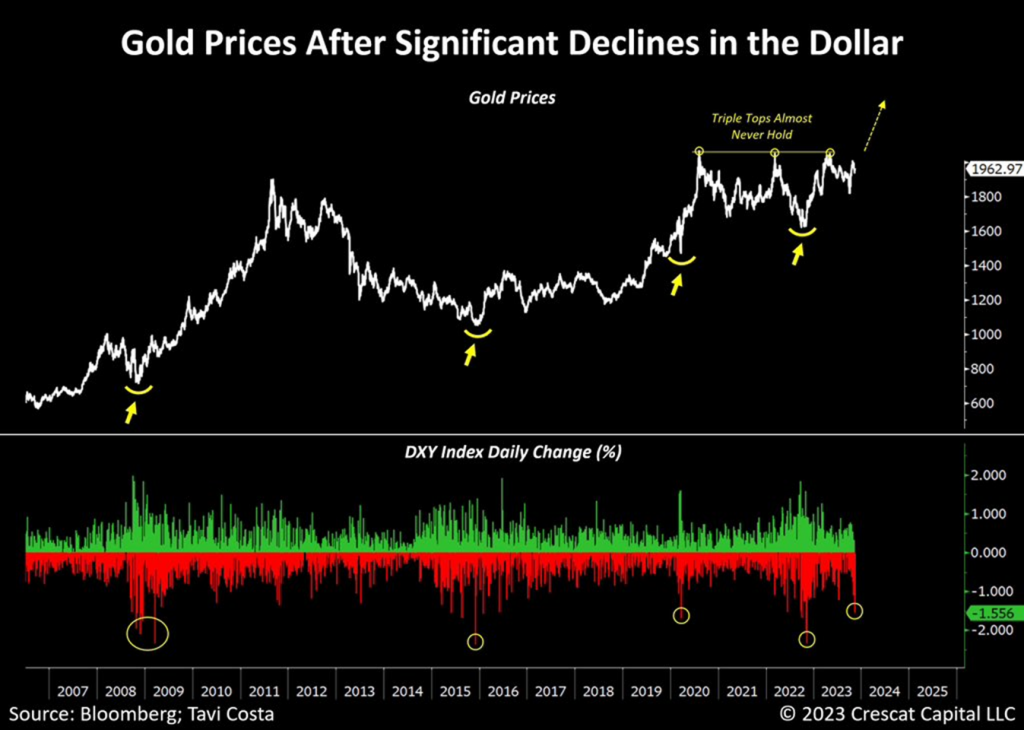
A decline in the dollar of today’s magnitude often coincides with major bottoms for gold. That perfectly aligns with the metal gearing up to break out from a historical triple top.
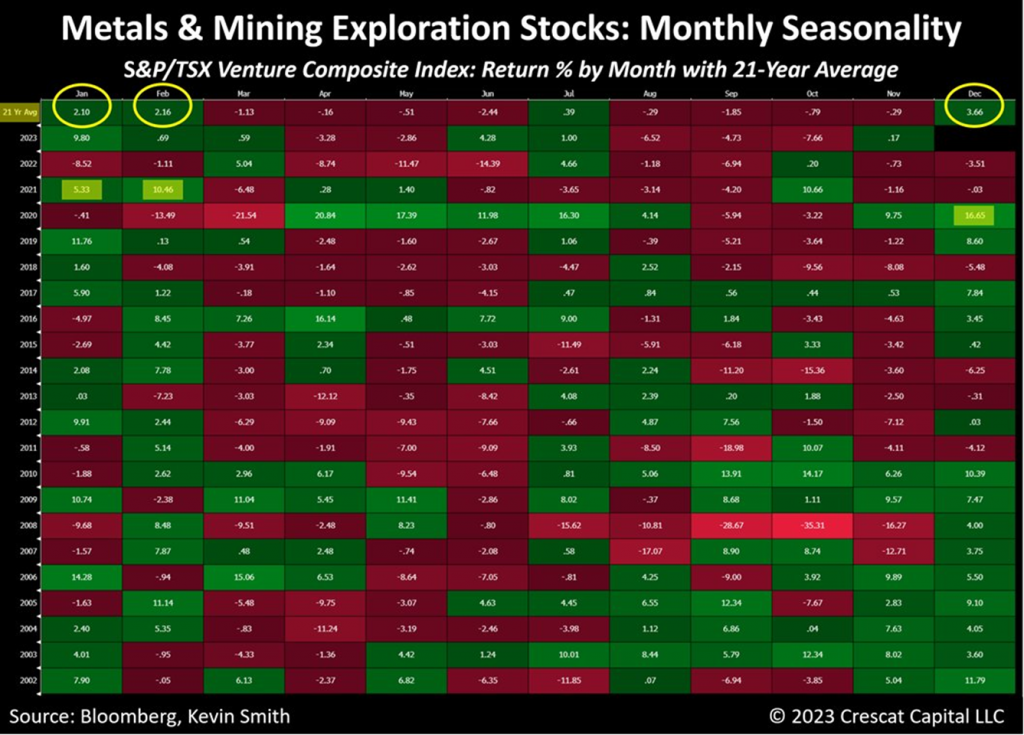
December Seasonality For Precious Metals Looks Compelling
What makes it timely is that December is the best month on average for the TSX-V over its 21-year history. This is followed by January and February, the next best months. For our taste, now is the perfect time to be adding money to this segment of the mining industry.
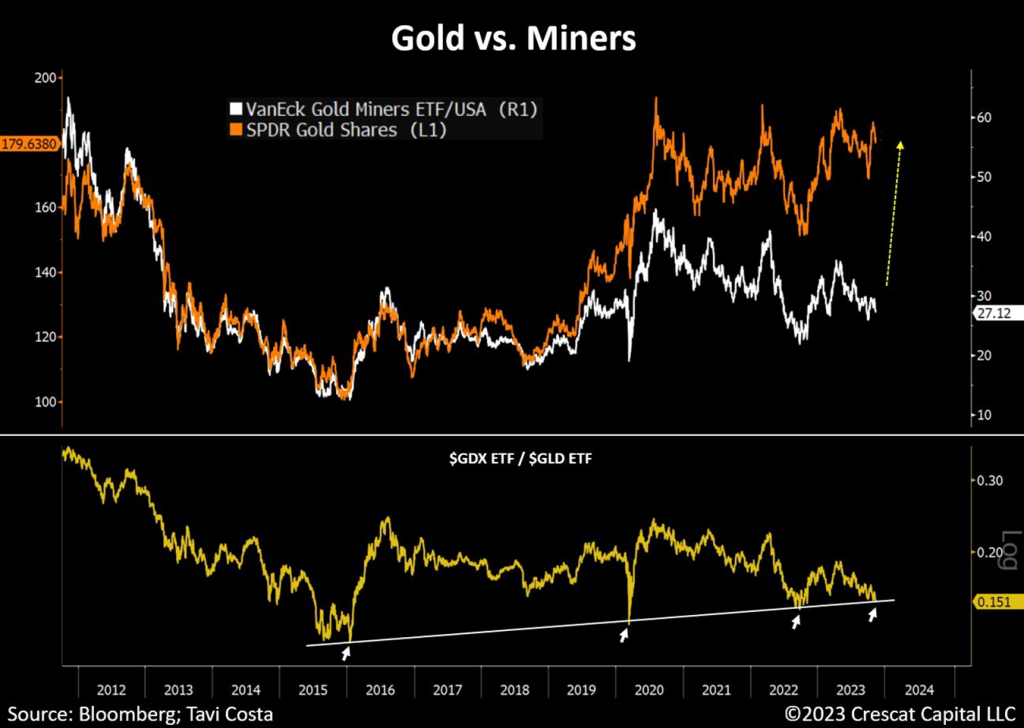
Miners: An Attractive Investment Proposition
The growing gap between gold and mining companies is about to gain significance as the precious metal gears up for a major breakout, likely marking the beginning of a new long-term cycle for precious metals. Although mining companies are complex capital-intensive businesses, there are significant stretches in history when the stocks in this industry have been exceptionally profitable investments.
If we are indeed on the verge of a secular move in gold prices, miners are arguably one of the most undervalued companies in financial markets today. In an environment where inflation remains higher than historical standards and hard assets excel, these stocks have the potential to yield significant returns, potentially including many multi-baggers.
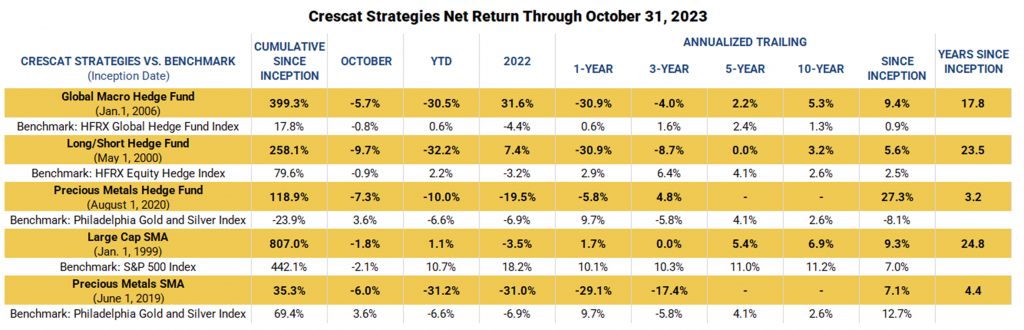
Performance data represents past performance, and past performance does not guarantee future results. Performance data is subject to revision following each monthly reconciliation and/or annual audit. Historical net returns reflect the performance of an investor who invested from inception and is eligible to participate in new issues. Net returns reflect the reinvestment of dividends and earnings and the deduction of all fees and expenses (including a management fee and incentive allocation, where applicable). Individual performance may be lower or higher than the performance data presented. The performance of Crescat’s private funds may not be directly comparable to the performance of other private or registered funds. The currency used to express performance is U.S. dollars. Investors may obtain the most current performance data and private offering memorandum for Crescat’s private funds by emailing a request to in**@*****at.net.
Timely Action
As we head into the holiday season, if you are taking some time to consider your year-end portfolio allocations, we would like to point out that December has been the single-best month historically on average for all three of Crescat’s private funds throughout their history.
We believe the pullback in our private funds in 2023 presents an extraordinary opportunity for new and existing investors who are not already fully allocated to Crescat’s strategies to seriously consider an investment. As we have outlined in this letter, the setup for both our long and short-sided themes combined to work in December and then into the New Year is potentially explosive. As we have shown in prior letters and in the latest video, our long portfolio on the activist metals front has incredible value and upside potential and is the largest thematic long exposure across all three funds.
As we showed above, December has been the single best-performing month for resource exploration stocks historically while January and February have been the next two best months. While we cannot make any promises, we truly expect this December to be a very strong month this year for all three of Crescat’s private funds, and one that is then followed by a great Q1.
We are confident that we are getting ready to capitalize on the shorts in our Global Macro and Long/Short funds where we have substantial asymmetric upside through our current put option positions ahead of a highly likely impending stagflationary recession. We have thoroughly outlined the numerous indicators of this looming downturn in this letter to serve as the catalyst for these short positions. The Precious Metals Fund is currently long-focused, but these other two funds are where investors also get exposure to Crescat’s macro-oriented short themes, as well as a variety of long themes in addition to the activist metals one.
Please reach out to Marek or Linda right away if you are interested in adding money before December. Their contact information is below. There is still time, but it is running out with only four more business days in November. We are making a strong push now because we truly believe this could be one of the best times in our firm’s history to invest in Crescat’s funds after a significant pullback and ahead of a potential substantial run, and we would love to see people take advantage of that.