Guest Post by Peter Schiff from SchiffGold.com:
This analysis focuses on gold and silver within the Comex/CME futures exchange. See the article What is the Comex? for more detail. The charts and tables below specifically analyze the physical stock/inventory data at the Comex to show the physical movement of metal into and out of Comex vaults.
Registered = Warrant assigned and can be used for Comex delivery, Eligible = No warrant attached – owner has not made it available for delivery.
Current Trends
Gold
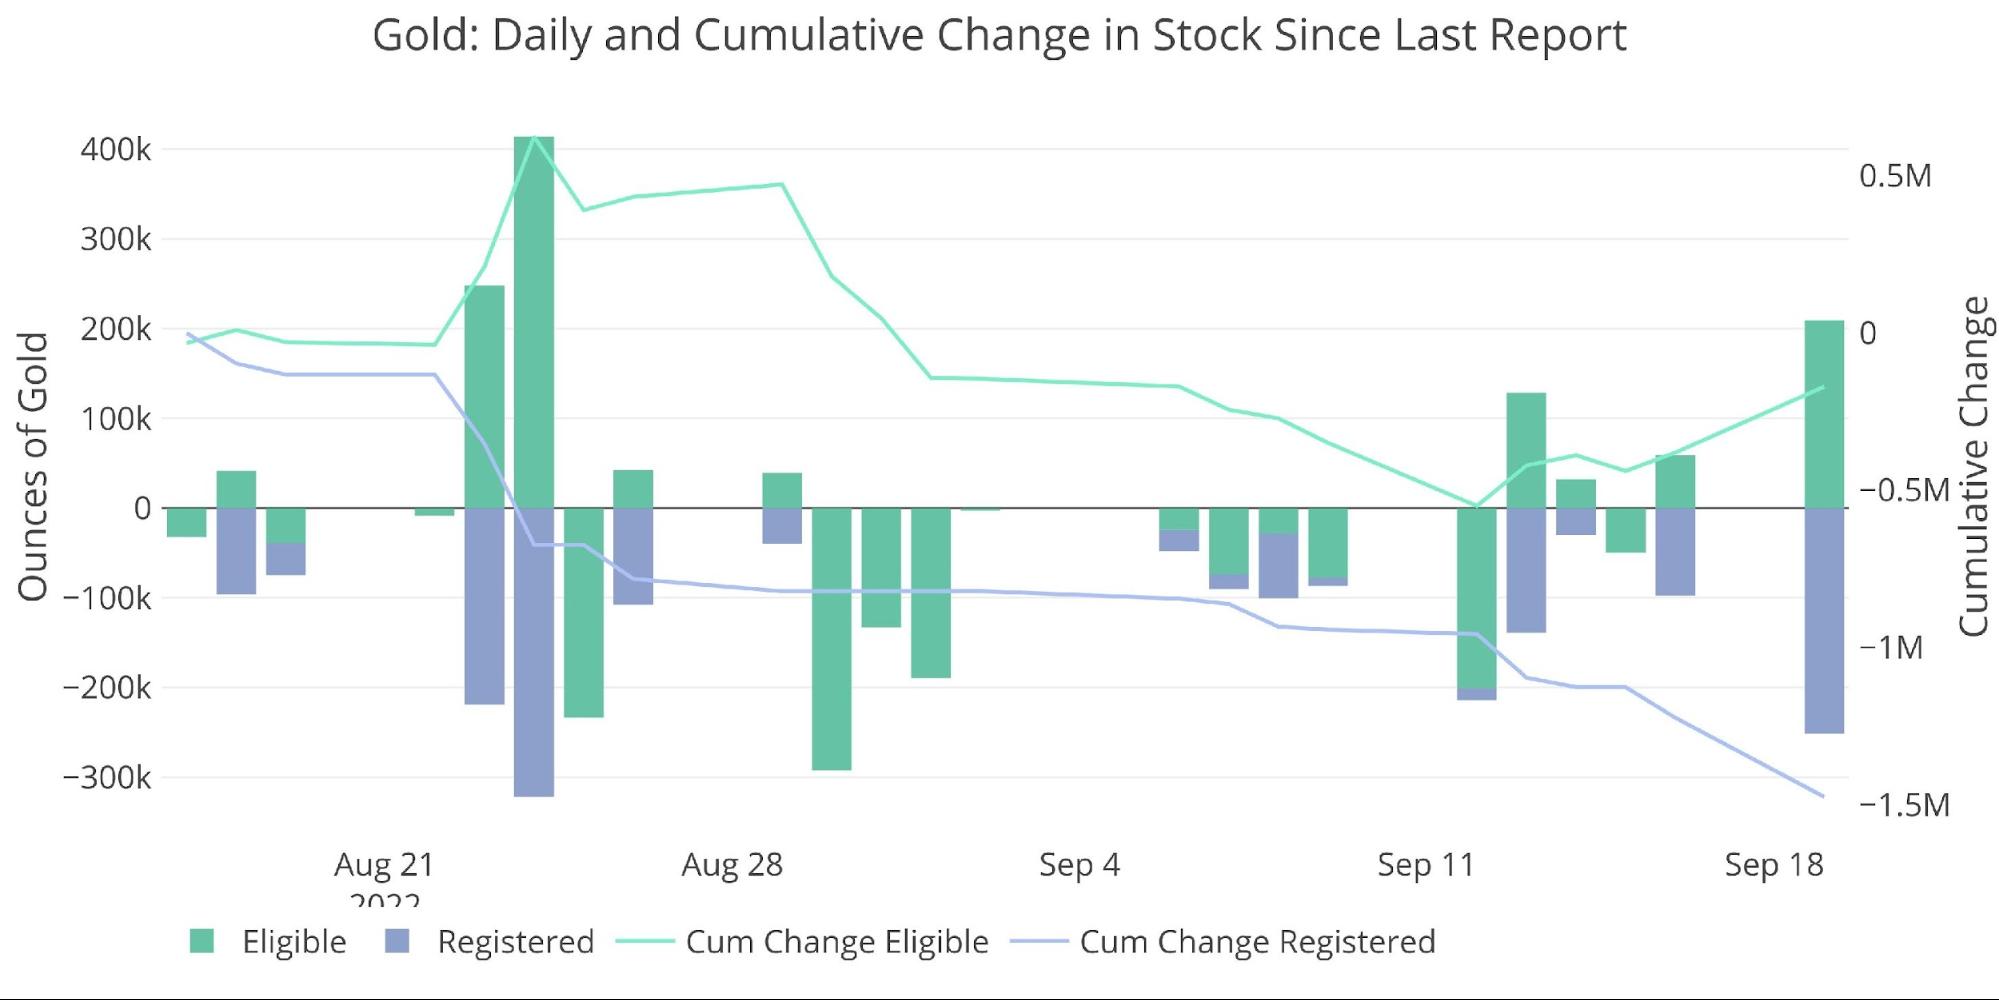
It’s been four months of a relentless decrease in gold holdings at the Comex. This was highlighted last month and the momentum has continued into September. Since May, almost $9M ounces of gold have left Comex vaults.
Figure: 1 Recent Monthly Stock Change
Over the last 30 days, Registered has seen a fall of 1.47M ounces with Eligible losing 170k. As shown below, nearly every day shows a net loss in metal.
Figure: 2 Recent Monthly Stock Change
Silver
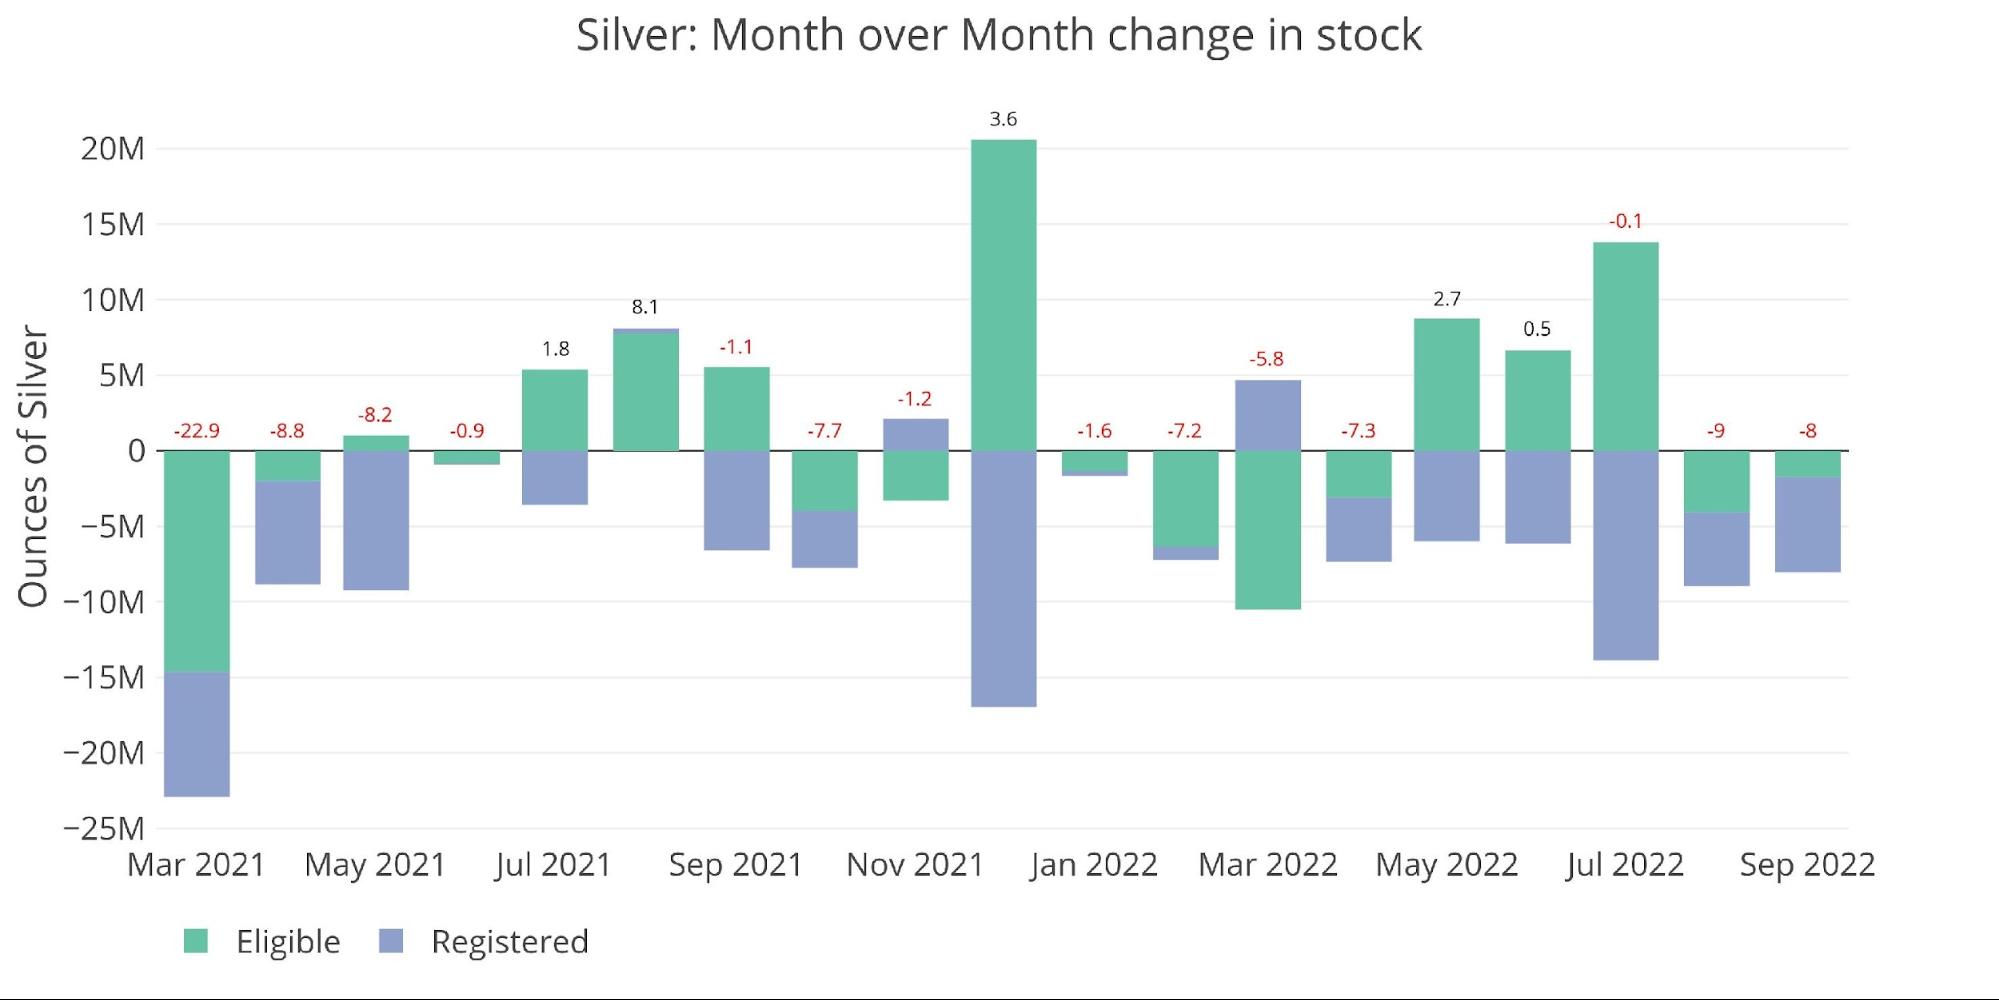
Silver is slightly different than gold. The action has been focused primarily on Registered metal (metal available for delivery). Only one month (March) has seen an increase in Registered since December of last year. In fact, since March of last year, Registered has only seen a meaningful increase in inventory in two months.
Figure: 3 Recent Monthly Stock Change
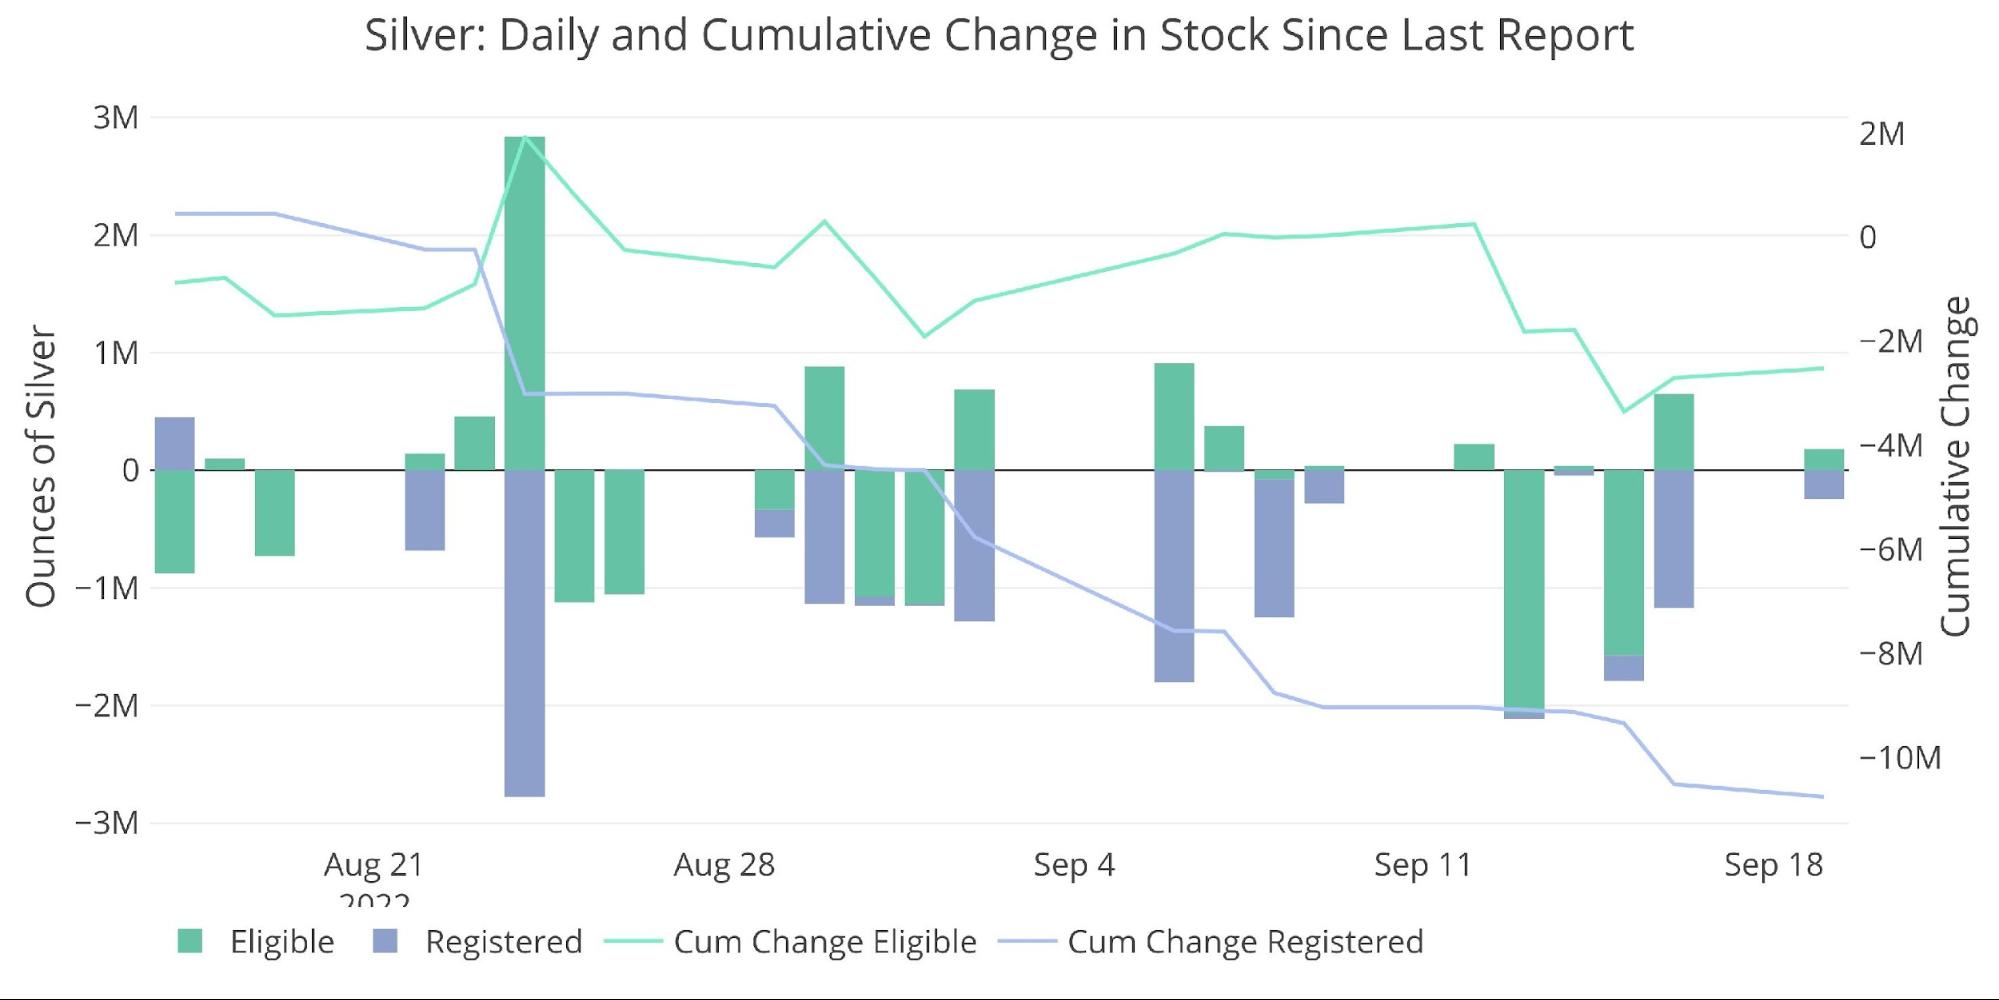
The bleed-out of Registered can be seen below with consistent movement out throughout the last 30 days. Nearly 11M ounces have left Registered during this time.
Figure: 4 Recent Monthly Stock Change
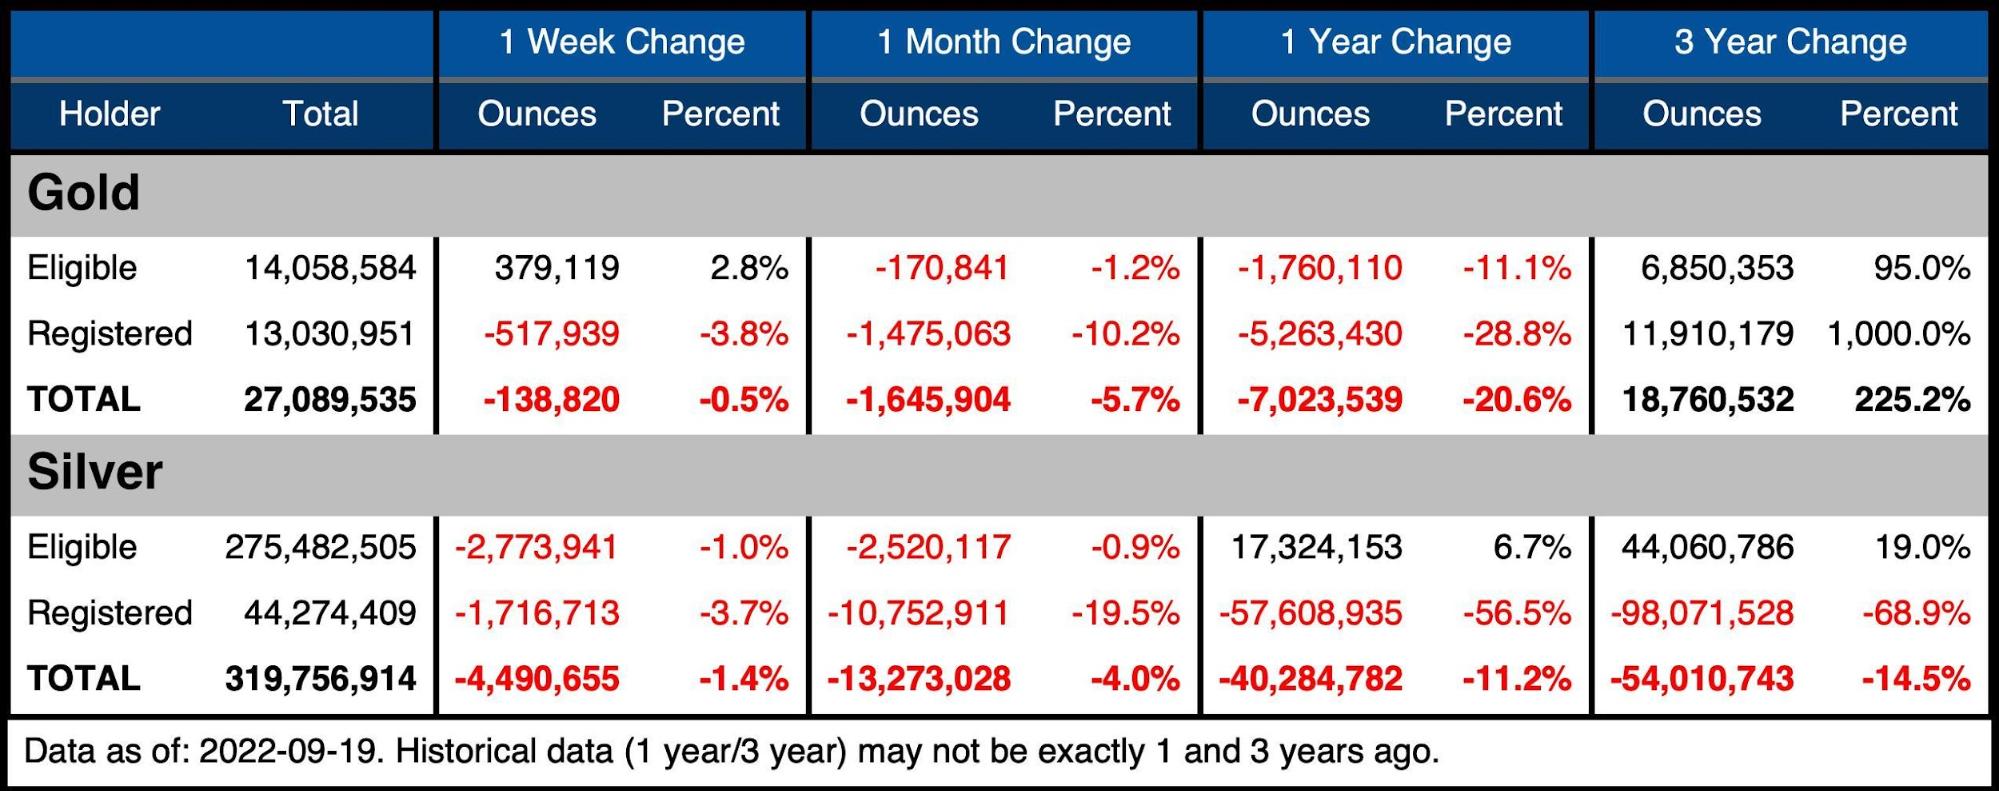
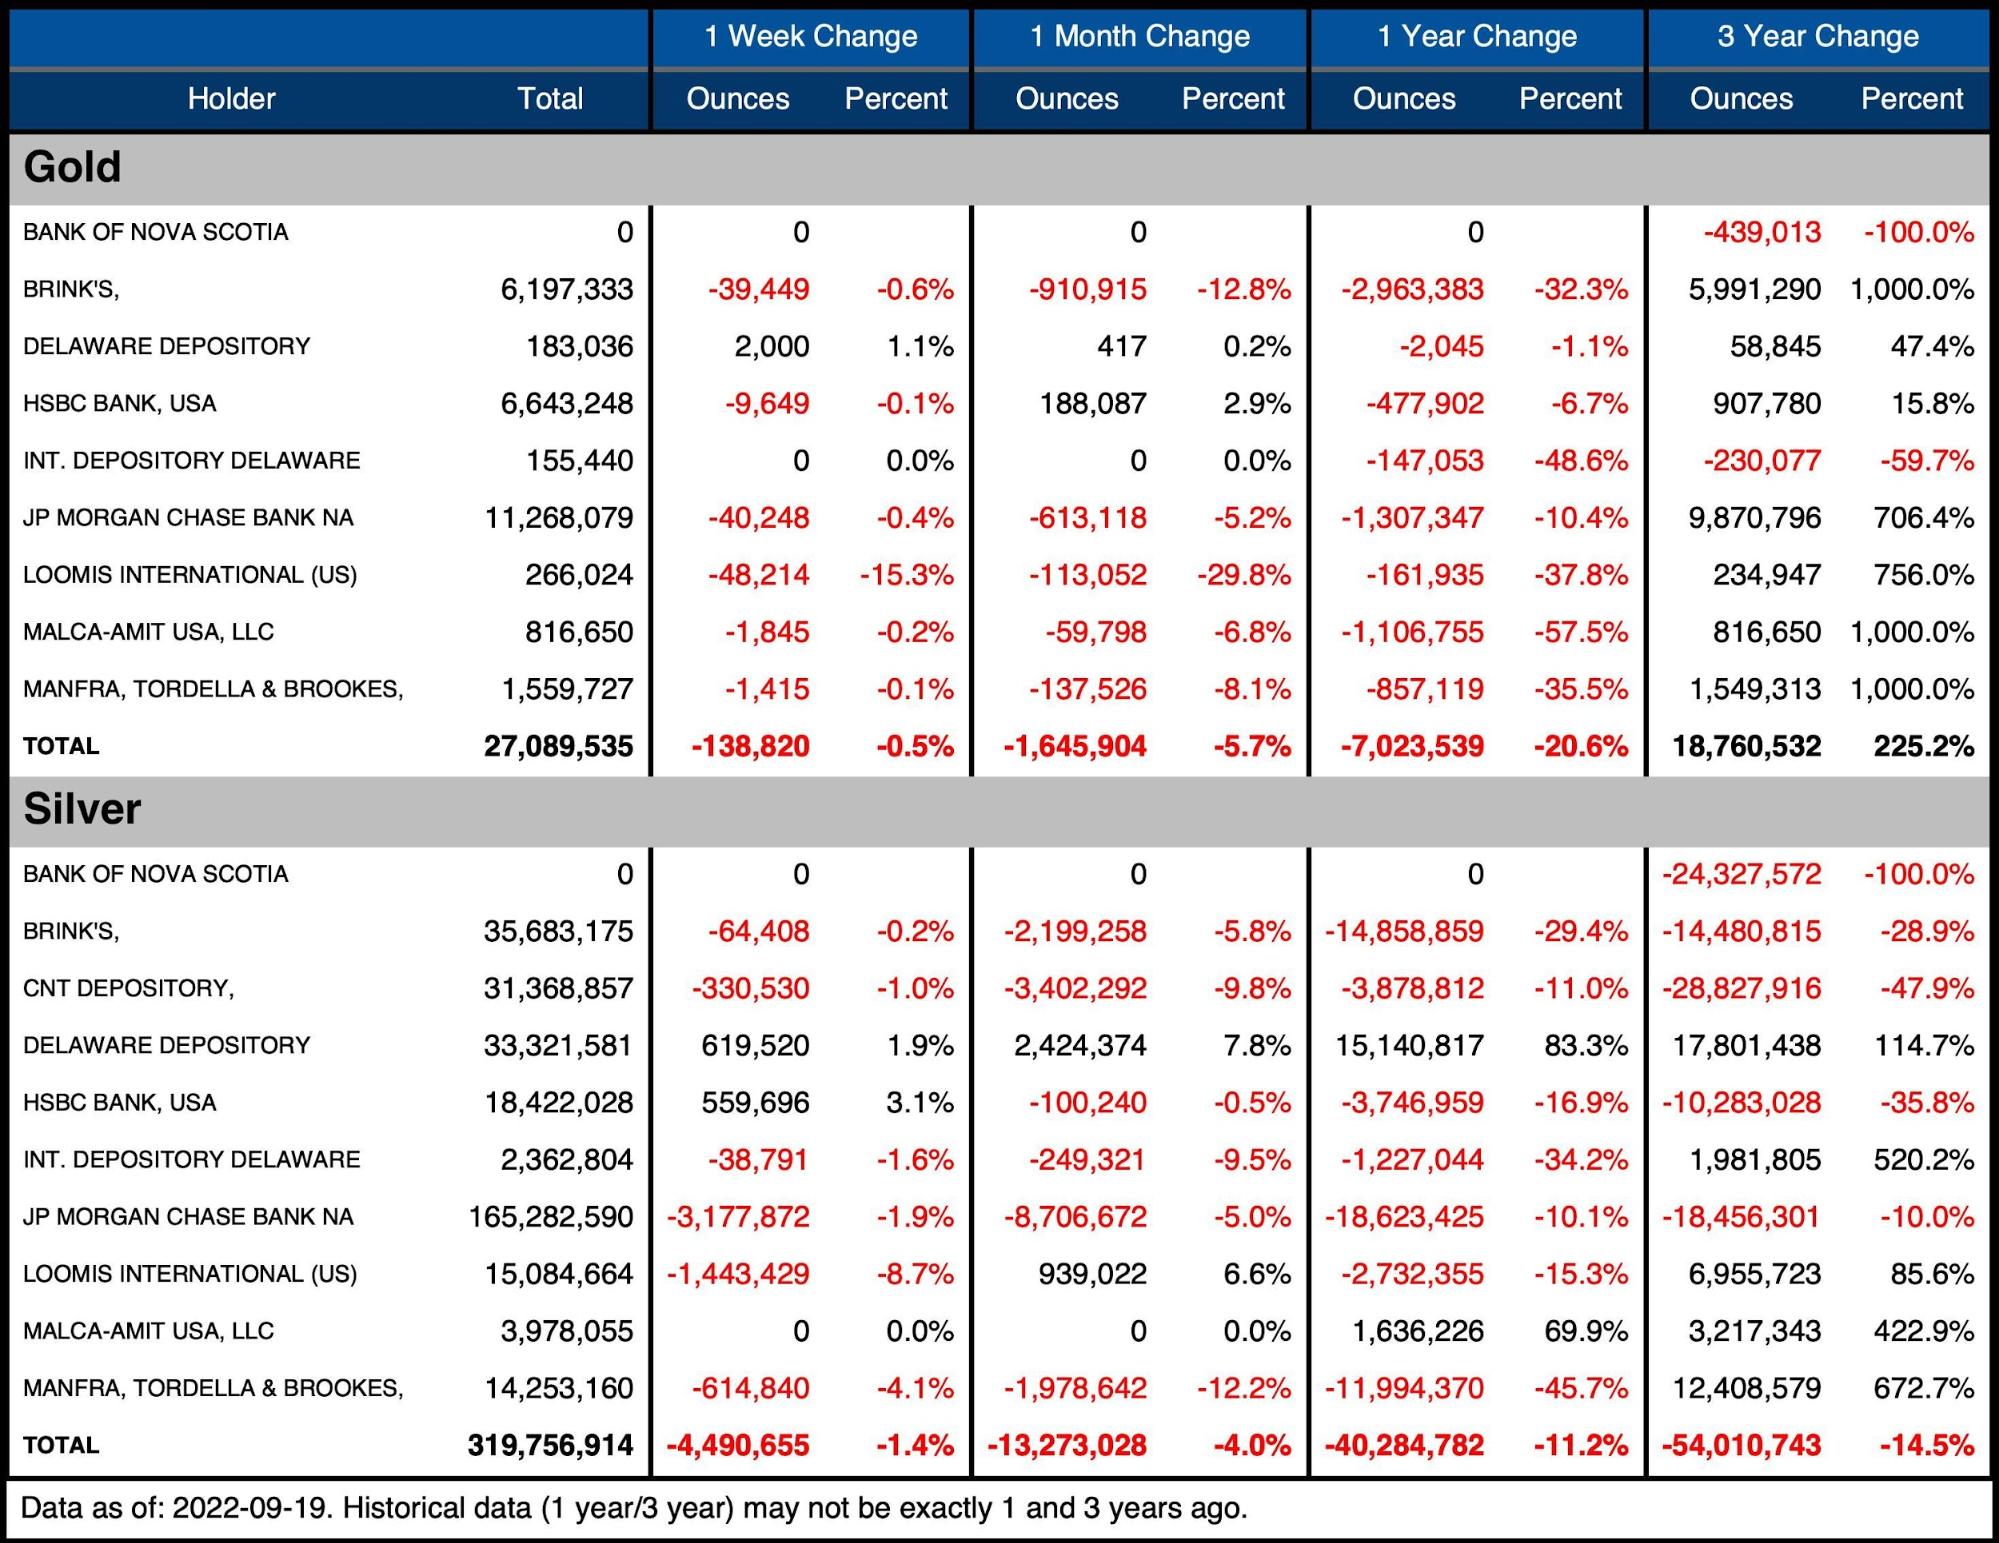
The table below summarizes the movement activity over several time periods to better demonstrate the magnitude of the current move.
Gold
-
- Over the last month, gold has seen Registered fall by 10.2%, or 1.4M ounces
-
- Combined with the outflow in Eligible, total inventories dropped 5.7% or 1.6M
- In the last week, the action has been Registered moving to Eligible
-
- Inventory is down over the past year by 20%
-
- Eligible is down 11% and Registered down almost 30%!
-
- Over the last month, gold has seen Registered fall by 10.2%, or 1.4M ounces
Silver
-
- Silver Registered is down by almost 20% in the last month
-
- Registered silver is down an incredible 56% in the last year and 69% over three years
-
- Eligible is nearly flat over the month, with a fall of 1.2%
- Combined, inventory has dropped 4% in the last month, but the fall in Registered is clearly accelerating
- Silver Registered is down by almost 20% in the last month
At the current pace, Registered silver could be fully depleted by January!
Figure: 5 Stock Change Summary
The next table shows the activity by bank/Holder. It details the numbers above to see the movement specific to vaults.
Gold
-
- Every vault has seen inventories fall over the last year with 5 vaults seeing supply fall by more than 30%
- Over the last month, 5 of 8 vaults lost gold with only meager gains seen in Delaware Depository and HSBC
Silver
-
- Silver has seen massive outflows MoM with 3 vaults seeing almost 10% or more reduction. 2 other vaults saw 5%+ reductions.
- Over the last year, only Delaware and Malca have seen increases in silver, with 7 vaults seeing sizable reductions (+10%)
Figure: 6 Stock Change Detail
Historical Perspective
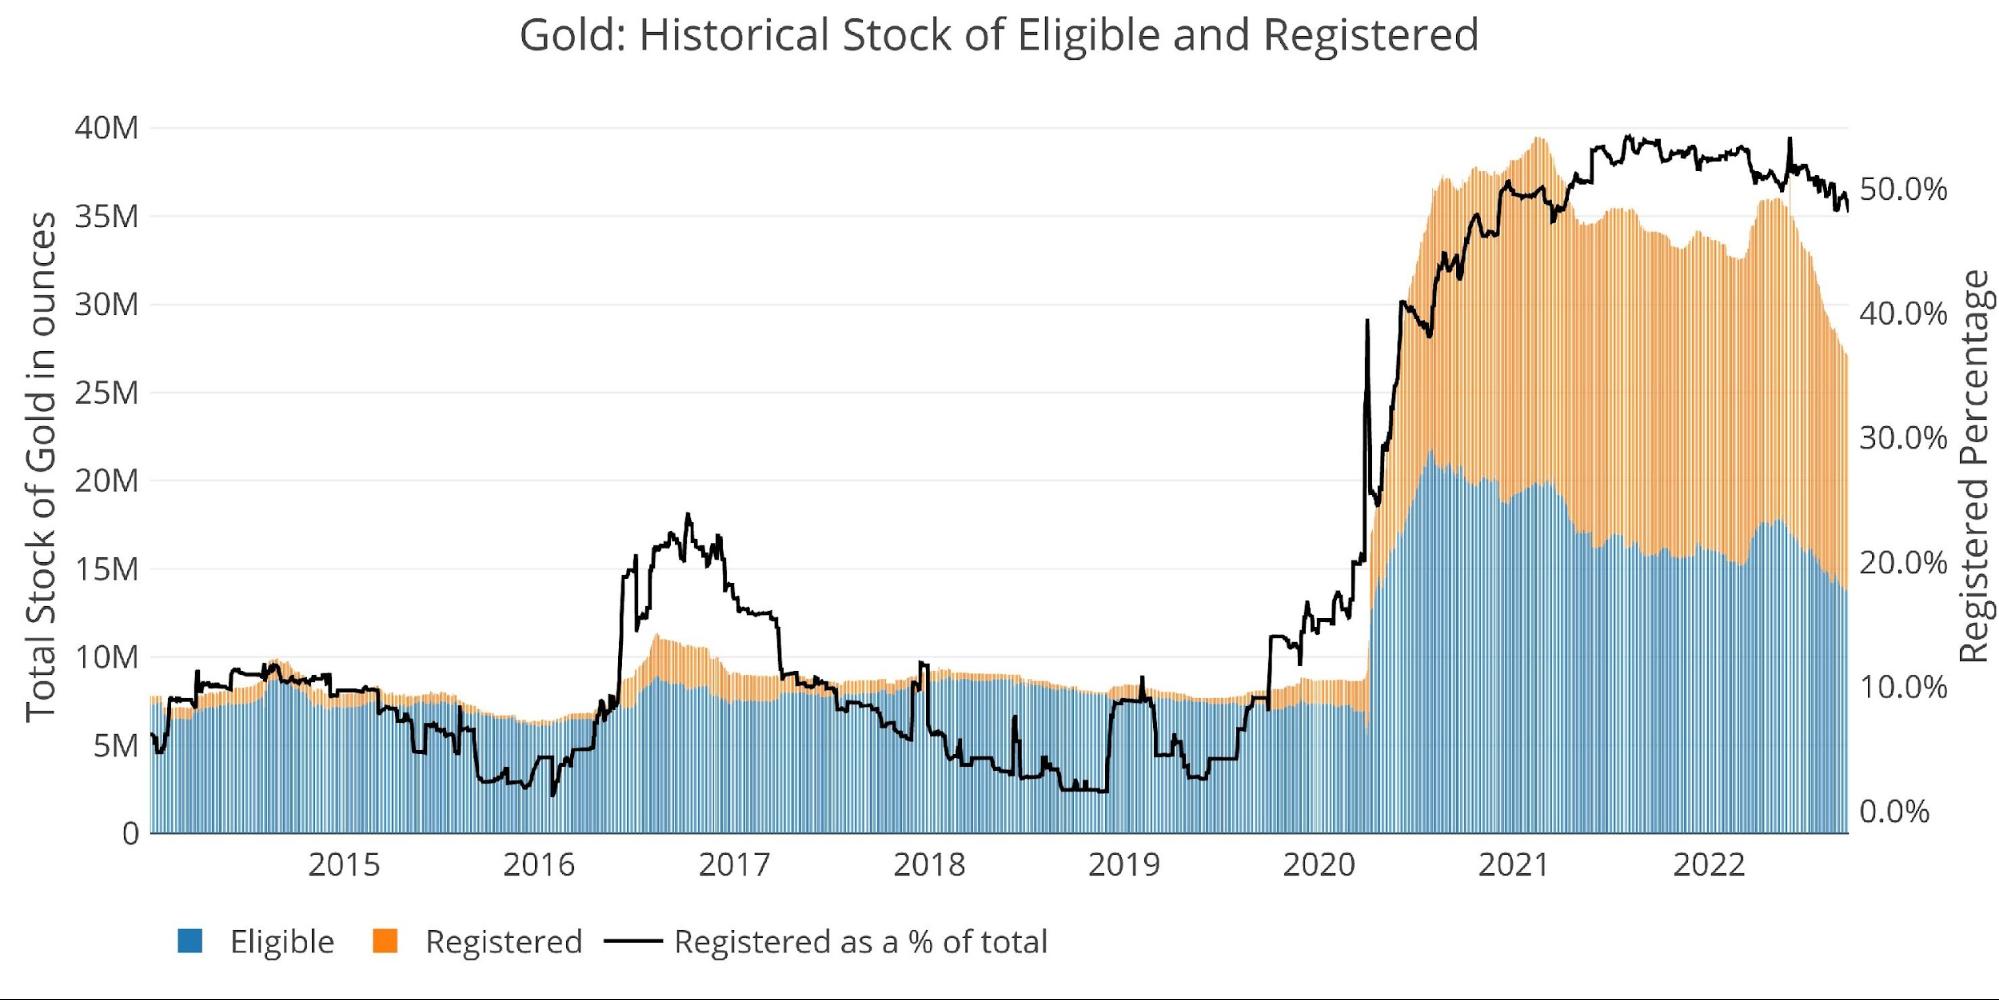
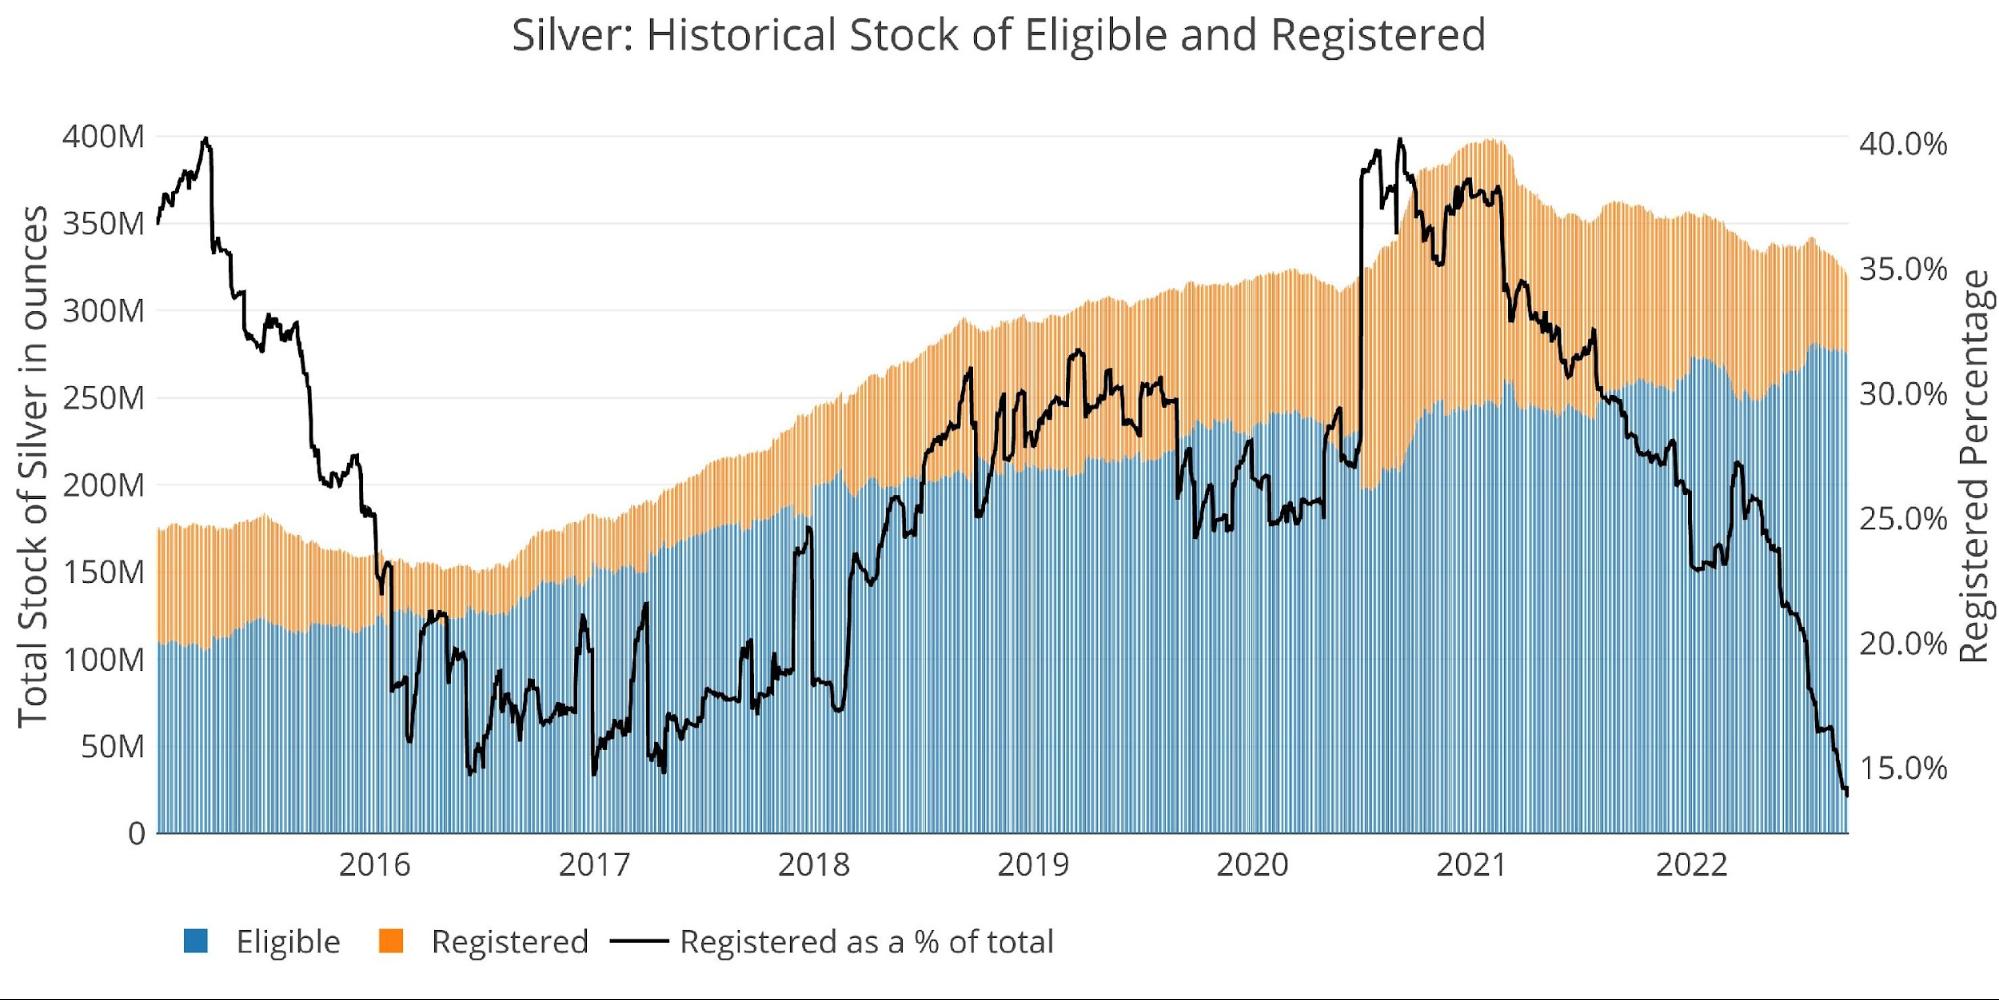
Zooming out and looking at the inventory for gold and silver shows just how massive the current move has been. The decline has been swift and steep, with losses seen in both Eligible and Registered.
Figure: 7 Historical Eligible and Registered
Silver has seen a massive move down in Registered as a % of the total (black line). In September 2020, Registered made up 40% of total Comex inventories. The number has crashed to 13.8%, which is now the lowest level since at least Jan 2015.
Figure: 8 Historical Eligible and Registered
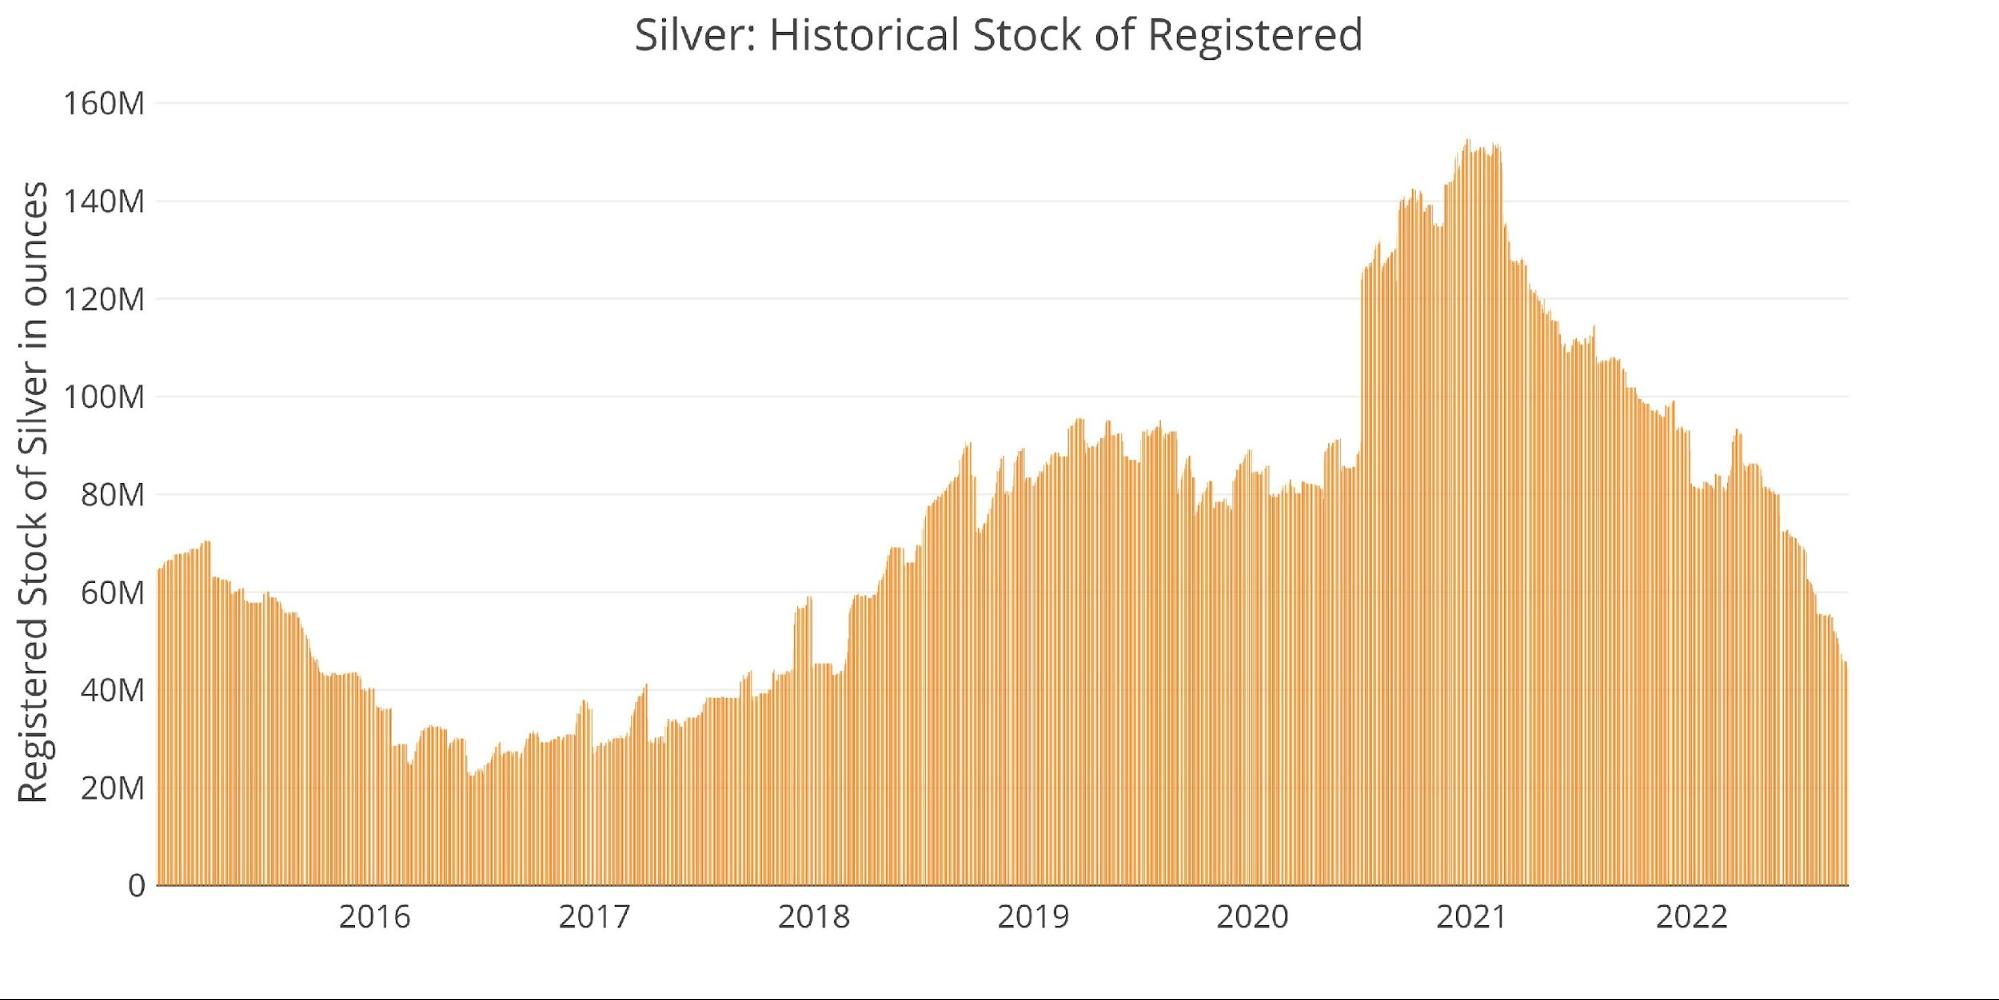
The chart below focuses just on Registered to show the steepness of the current fall. In Feb 2021, there were 152M ounces of Registered. That number now sits at 44M, which is a net fall of 108M ounces. Considering the recent acceleration, total holdings could fall below 2016 levels within a few months.
Figure: 9 Historical Registered
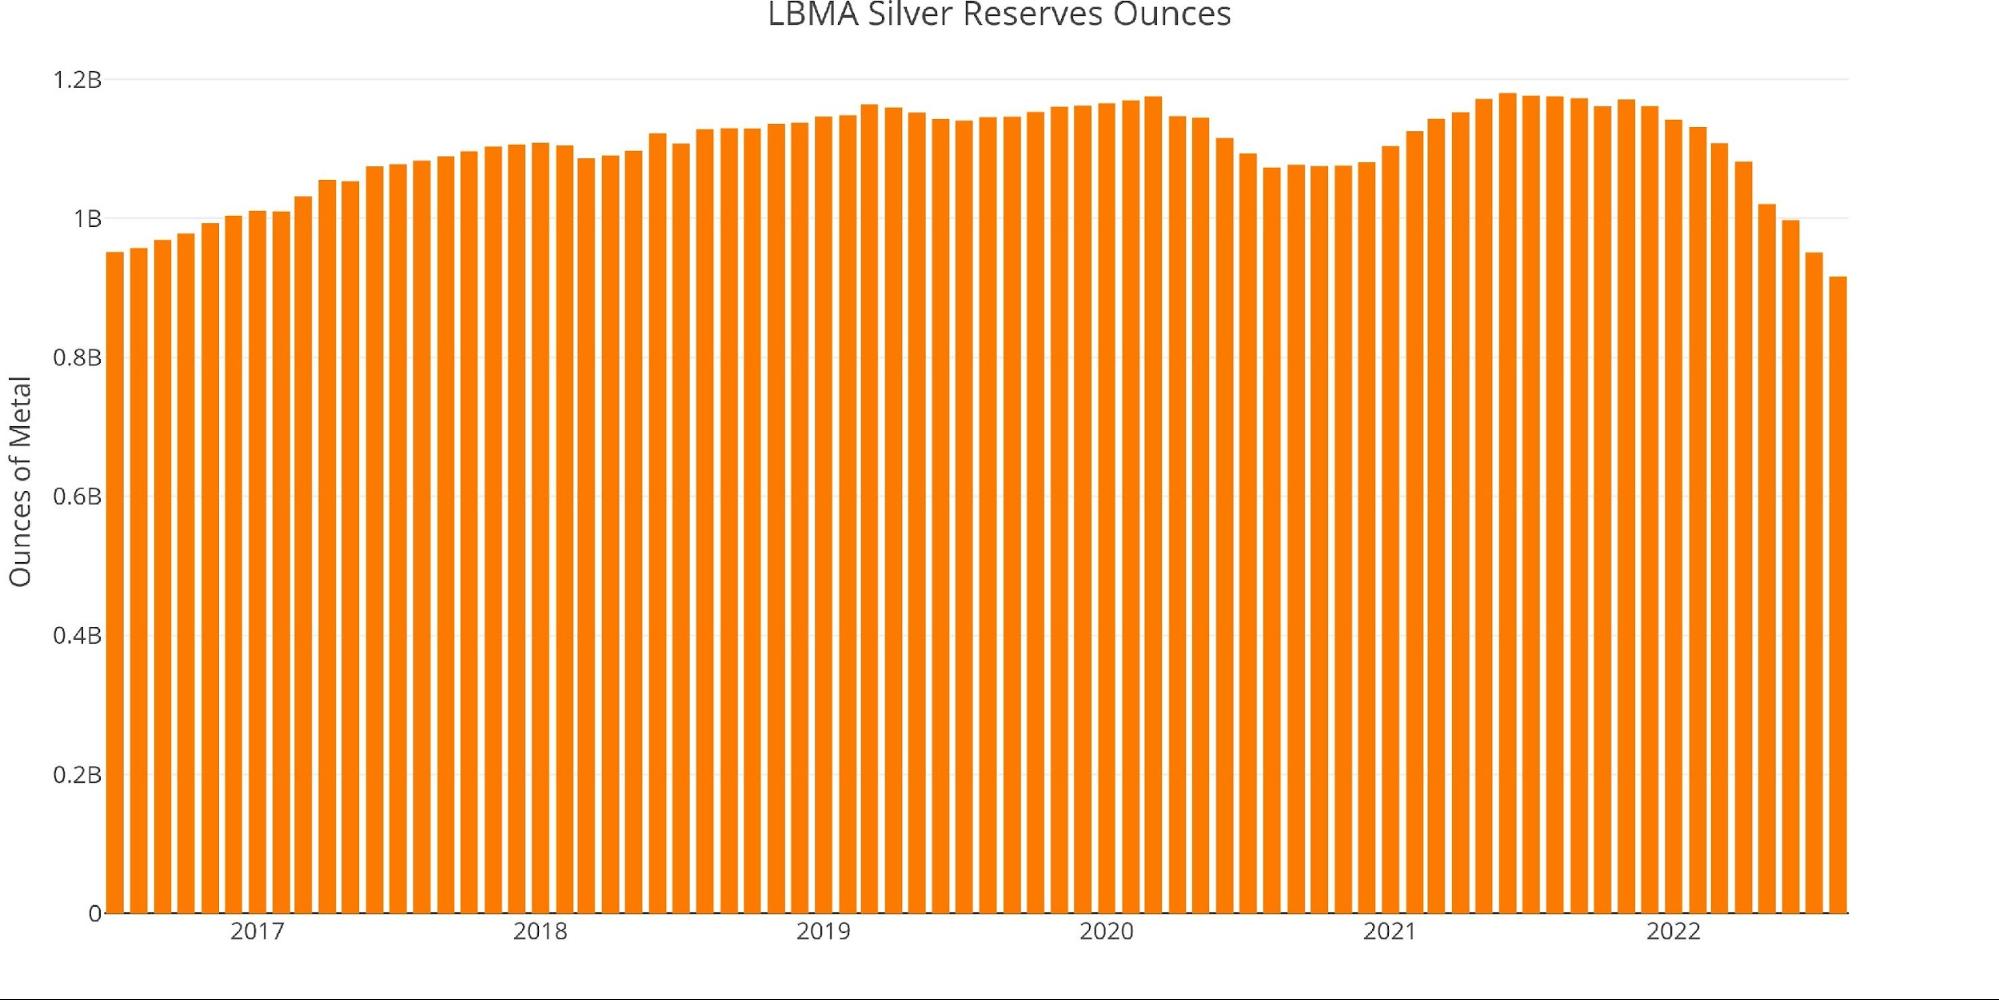
Comex is not the only vault seeing big moves out of silver. Below shows the LBMA holdings of silver. It should be noted that much of the holdings shown below are allocated to ETFs. Regardless, total inventories have fallen every single month since November. Holdings fell below 1B ounces in June and now sit just above 900M as of August.
Figure: 10 LBMA Holdings of Silver
Available supply for potential demand
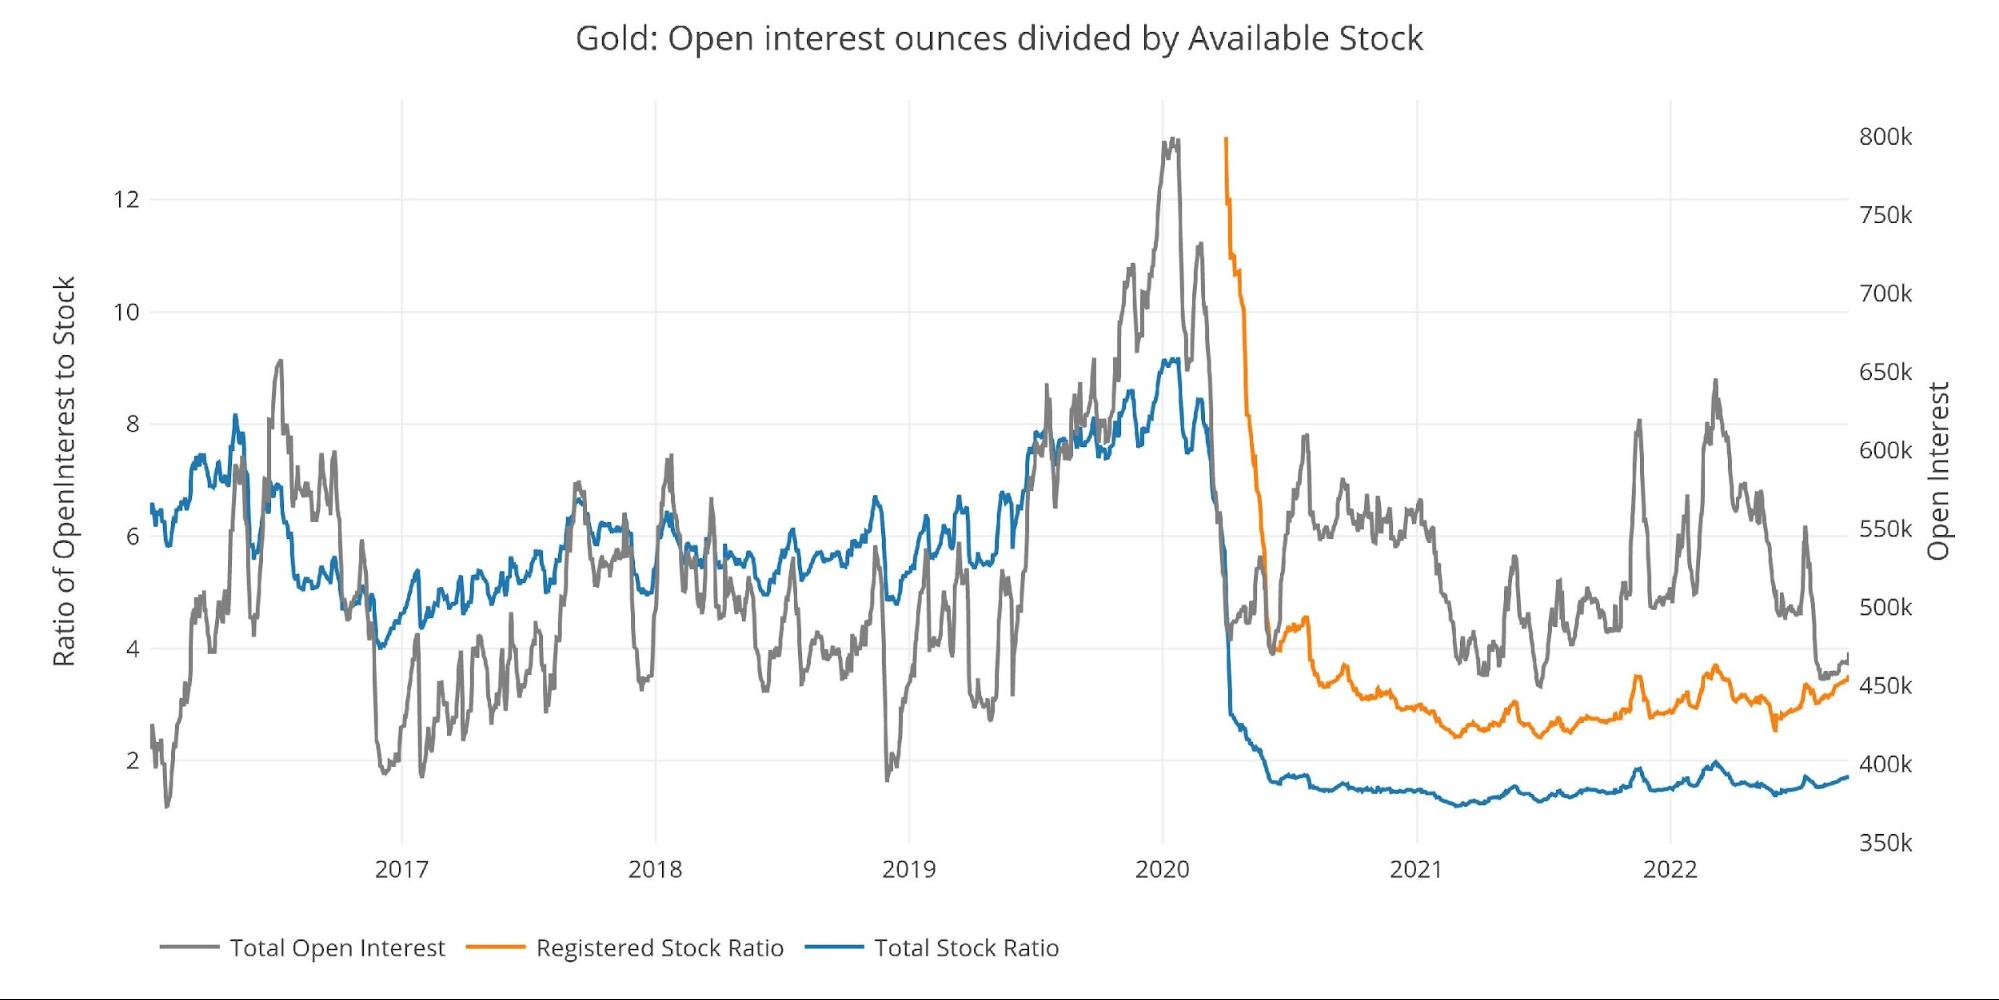
These falls in inventory have had a major impact on the coverage of Comex against the paper contracts held. There are now 3.4 paper contracts for each ounce of Registered gold within the Comex vaults. The coverage would actually be far worse if the total open interest had not plummeted in recent weeks.
Figure: 11 Open Interest/Stock Ratio
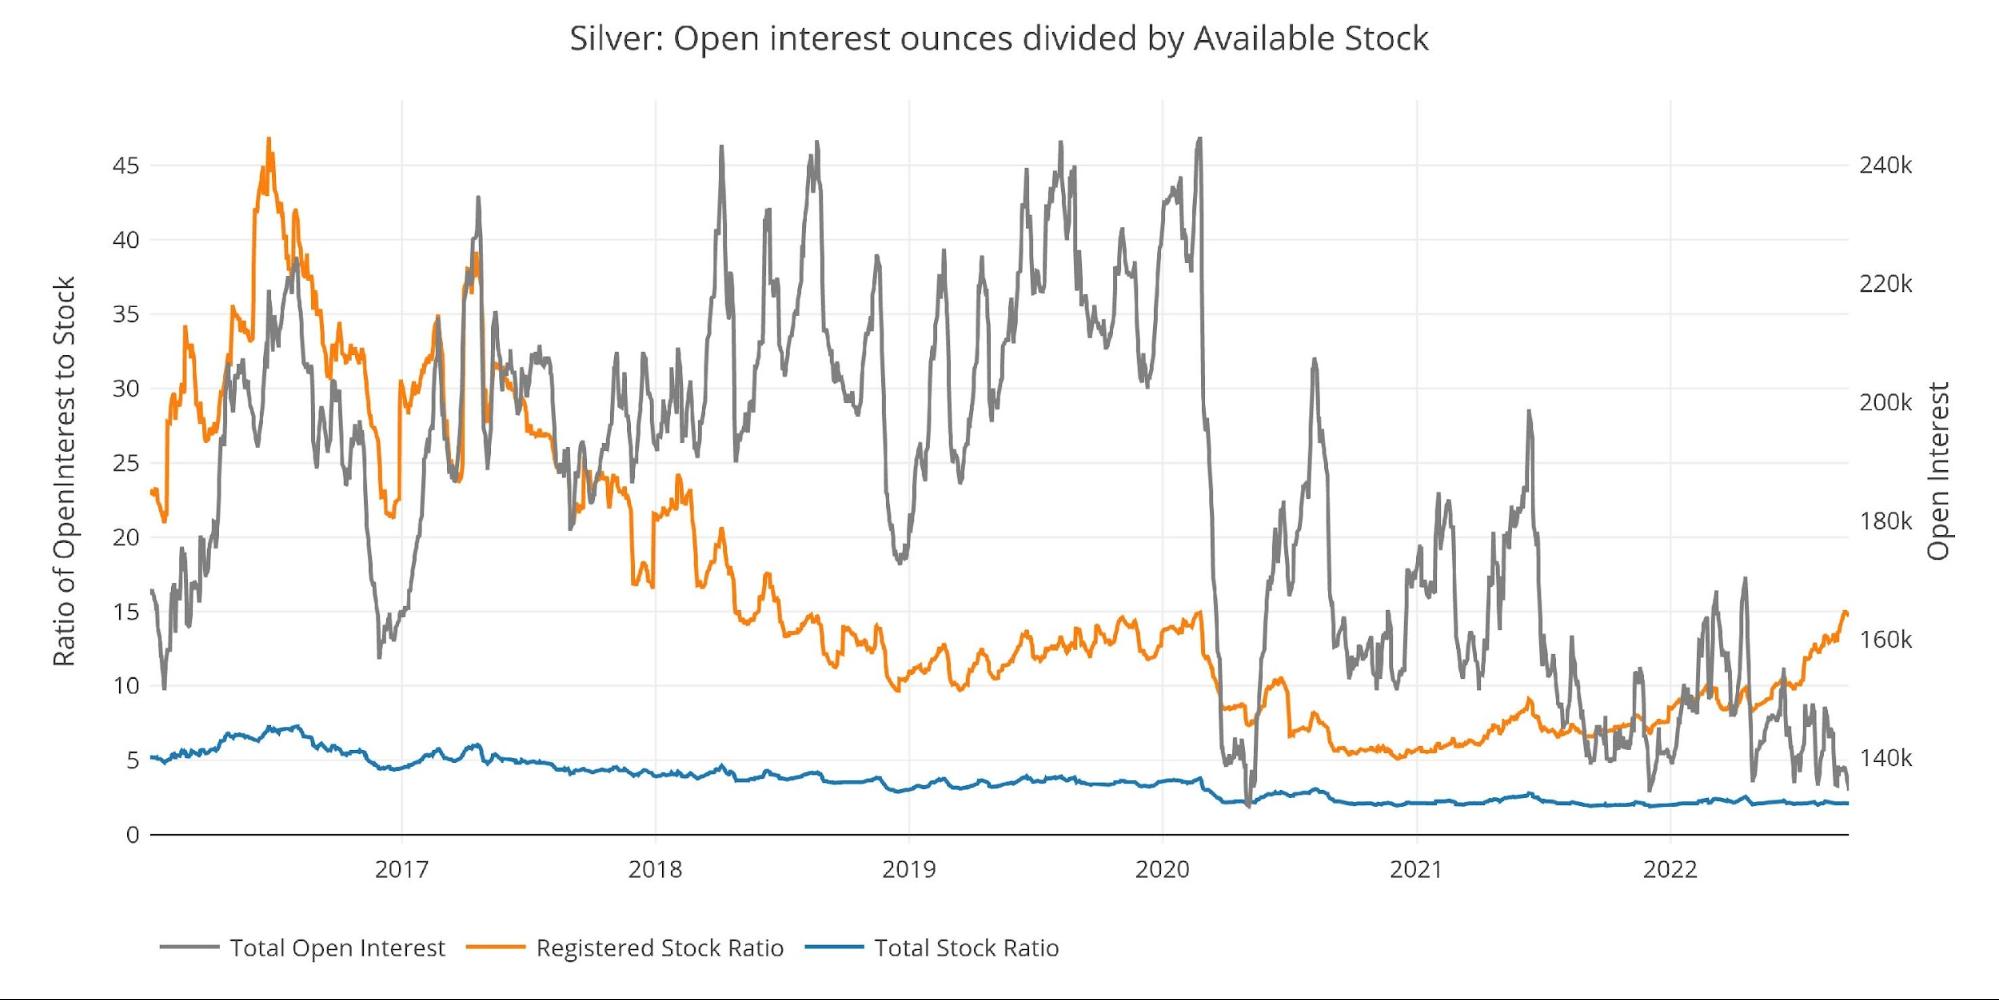
Coverage in silver is far weaker than gold with 15 paper contracts for each ounce of Registered silver. This is the worst coverage since June of 2018 when total open interest was almost 61% higher.
Figure: 12 Open Interest/Stock Ratio
Wrapping Up
The physical demand for gold and silver has been voracious. While the price is still being controlled by the paper market, it’s clear that something in the physical market could trigger a major shift. As supplies continue to dwindle, it’s only a matter of time before shorts will get stuck without being able to deliver. At the current pace, this is not something that will happen in a few years. It could be a few months!
The price action in gold and silver does not suggest that supplies are starting to run thin, but the data is ringing the alarm bell for anyone who wants to listen. Physical is in demand and investors want it now! Prices will catch-up. Make sure you are positioned before they do.
Guest Post by Peter Schiff from SchiffGold.com.
America’s Permanent Collapse?
Former Goldman Sachs managing director, best-selling author, and Federal Reserve expert reveals to public to what’s really happening in America. (The hidden story, beyond: inflation, rent increases, gas, groceries, political division, or a pandemic.).
The exact reason the financial elite continue to get richer grabbing more power…all while everyday folks struggle to live their daily lives.
Click Here For The FULL Story.


