
Guest post written by Keith Weiner, at monetary-metals.com:
The Macroeconomic Brief: What you always needed to know, but they were afraid to tell you
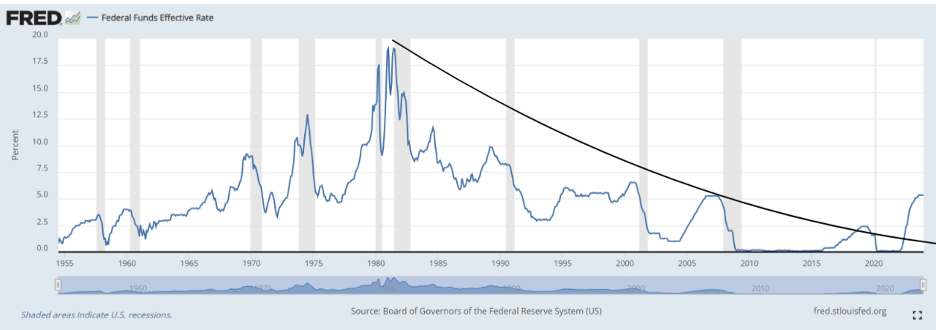
The talking heads are talking about recession, unemployment, and inflation. The same as they’ve always done, though now perhaps with a bit more urgency. Most people have a sense that hiking the Fed Funds Rate from 0 to 5% in 18 months has to have some consequences. The last time the Federal Reserve hiked like this—June 2004—it led to the global financial crisis in 2008. Then they hiked by one percentage point less, and they stretched it over 25 months.
But the problem is that most observers don’t understand the chain of cause and effect (or if they do, they don’t discuss it clearly, and in the open). One type of commentator thinks in terms of what can only be called oversimplificationism. If the yield curve inverts, he says—i.e. 10yr Treasury yield is less than 2yr Treasury yield—and then un-inverts, recession comes next.
Here’s a graph of the yield curve on February 27. Not un-inverting yet, but so what?

Source: https://www.ustreasuryyieldcurve.com/b/J0dgfI
Maybe un-inversion indicates imminent recession—but why?
Another type follows indicators which are concurrent or, worse yet, lagging. Such as employment. Or the rate of “quits”—i.e. when workers voluntarily resign vs. when they are laid off.
This is like driving a car looking out the side window.
Other commentators follow whatever real-time data they prefer, such as credit card spending, gasoline consumption, or a statistic like GDP Now. The official GDP number is available only up to Q4 2023 as of this writing, but GDPNow shows Q1 2024 (positive growth).
While real-time data series may be less rearview mirror than the official GDP number, they are hardly predictors of what’s coming, much less explaining why it’s coming.
Understanding the Current Dynamic in Context of the Previous Dynamic
At the same time as the relentless rise in costs which sap return on capital, there has been a flood of new credit pumped into the market, in exponentially increasing quantities. Necessarily, it has been pumped at ever-falling interest rates. This is because the demand for it only existed at lower rates. It was very much a matter of fresh credit chasing limited opportunities, rather than abundant opportunities demanding finite credit.
Of course, the Fed cannot print real capital. But a borrowed dollar can buy some real productive capital, such as farmland. So long as the cost to borrow this dollar is less than the return generated by this farmland.
The cost of that borrowed dollar was falling for over 40 years. Hence the return on real productive assets has been falling in lockstep.
It’s Dangerous to Wear 2D Glasses in a 3D World
Most people think that, because consumer prices increased—what they define as inflation—then interest rates must somehow rise to compensate investors for it. People assume that prices, wages, margins, profits, and return on capital all increase equally when new dollars come into the market. That a change in the interest rate is neutral.
This assumption is textbook, literally, for mainstream economic analysis. It’s the beating heart of the supply and demand simulations you learned in high school. But the supply and demand model is a 2D black-and-white static snapshot. Alas, the world is color and 3D, and everything is in motion. The supply and demand model asks what if we changed this one variable and held all other variables constant? In other words, what if the world were frictionless, massless, static, simple, and non-dynamic? Of course, it isn’t. Of course, the other variables aren’t constant.
Four decades of falling interest rates and a falling return on capital will not be reversed by rising consumer prices. Especially not if the rise in consumer prices is due to non-monetary causes. Especially not if the root cause is that the business environment continues to sour.
Something’s got to give, but what?
No matter how much demand is reduced by higher rates, supply must be reduced more. Until, despite reduced demand and increased useless ingredients, return on capital finally becomes greater than cost of capital, i.e. the interest rate.
The Fed has jacked up the rate of interest massively, thus prices must rise massively unless the Fed reverses course.
Sooner or later, something has to break. The question is what?
Download the full Outlook Report for free to read what we think will break, and when.
Now we turn to the roughly 500-ounce question…what is likely to happen with the prices of the metals this year?
Gold and Silver Price Predictions for 2024
Dollar Yields vs Gold Yields
Much has been written about the opportunity cost of holding gold. The higher the rate on Treasurys and especially T-Bills, the more people want to trade their gold which does not have a yield (except for Monetary Metals clients) for Treasuries.
Right now, one-month T-Bills pay around 5.5%. This is surely a big part of why Westerners are not buying gold. What will happen if T-Bills slam back down to 0%?
Demand for Physical, Waxing or Waning?
In both metals, we have to say that demand for physical is robust. This is not a speculator’s market, where people are buying futures with leverage while others are selling metal to cash out.
But, not entirely. Some European clients are reporting they are getting lots of customers coming in to sell metal. Including silverware. Some American clients report weaker sales volumes, with lower premiums on coins.
However, in our direct observation, demand for metal in the Middle East, India, and Asia, is very robust. In countries which impose import restrictions, there are substantial local premiums on gold compared to the London price.
We have a market where Western selling of physical is more than matched by Eastern buying. And selling of futures (probably Western) balances it out and we see a market price of $2,021.
We are well aware that this picture of Western selling to Eastern buyers is a perennial favorite among permabulls. It’s not always true (we have written of times when it was not). But it is, at this moment.
This will either be resolved by Eastern capitulation or by a resumption of Western appetite. Perhaps the currencies of, e.g., India and Turkey, will stabilize. And perhaps the tooth fairy will put an ounce of gold under your pillow tonight.
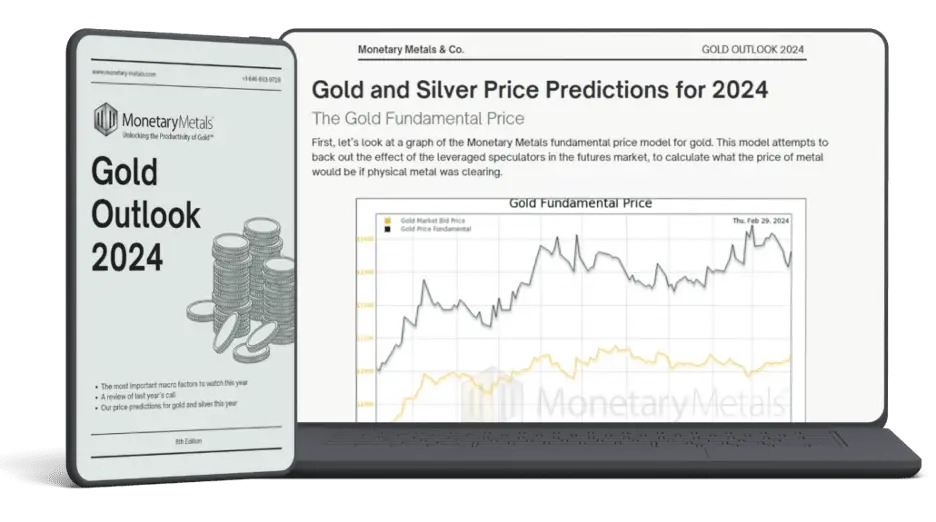
With all this as backdrop, what are the Monetary Metals Fundamental Price Indicators saying?