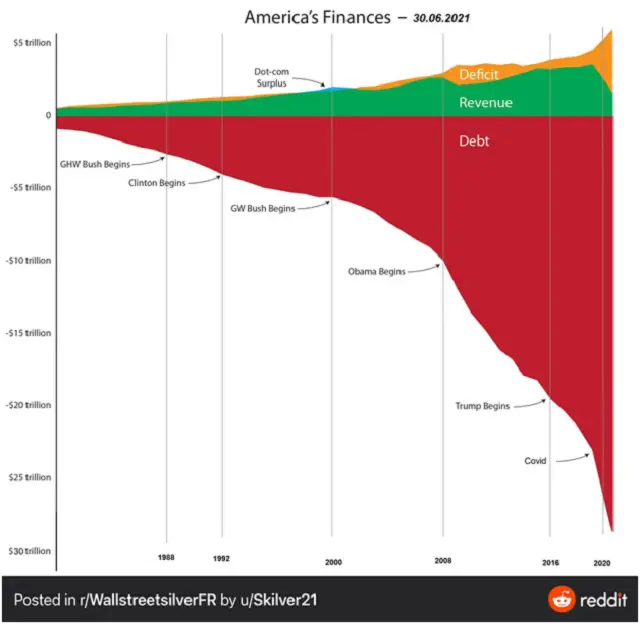
One glance at this chart should silence any talk of “a return to normalcy”. We are emphatically not headed in a normal direction.
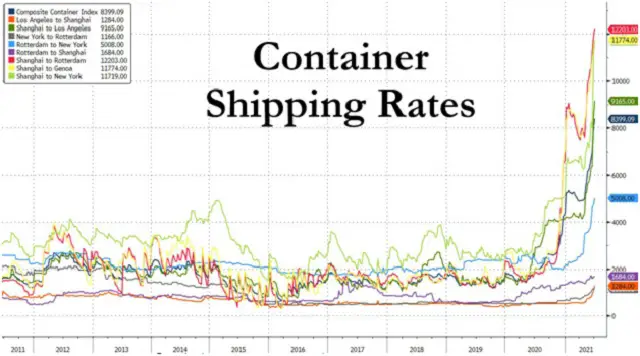
The liquidity being generated by this debt binge is pushing up prices in a wide variety of sectors. Shipping costs, for instance, are soaring…
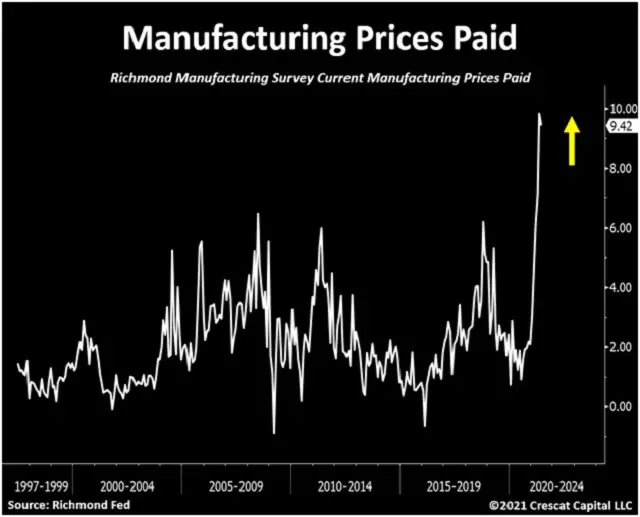
… which is raising manufacturing costs for any company that buys materials or components from overseas (in other words all of them).
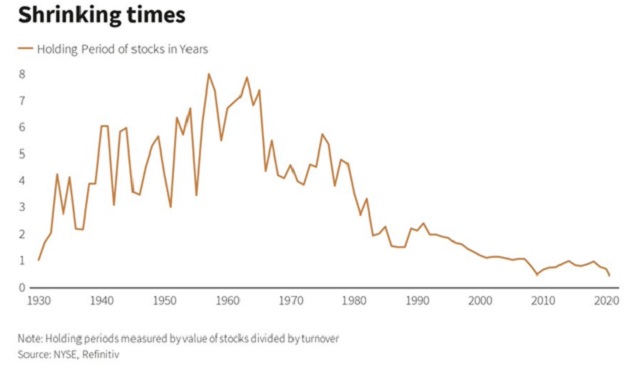
At the same time, a tsunami of hot money pouring into the financial markets is turning investors into speculators. Where most stockholders, both professional and amateur, used to hold their positions for years, today’s overstimulated players now go in and out in months.
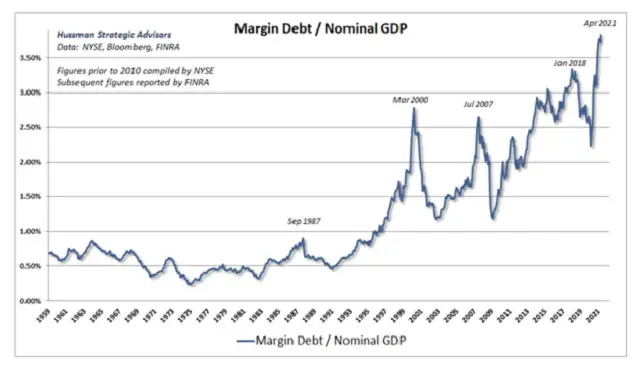
And they do it with borrowed money. Margin debt – created when an investor borrows against existing stocks to buy more – is spiking, not just in nominal terms but as a percent of GDP.
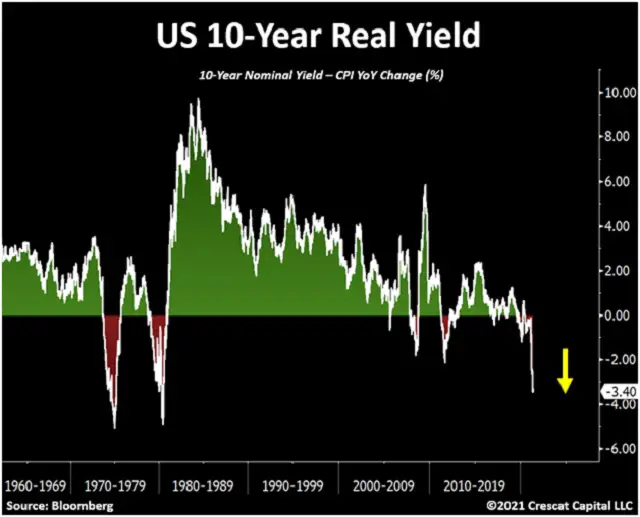
Over in fixed income, hot money has kept bond yields from rising along with inflation, producing a negative inflation-adjusted (i.e., real) yield on 10-year Treasuries, something not seen on this scale since the inflationary 1970s.
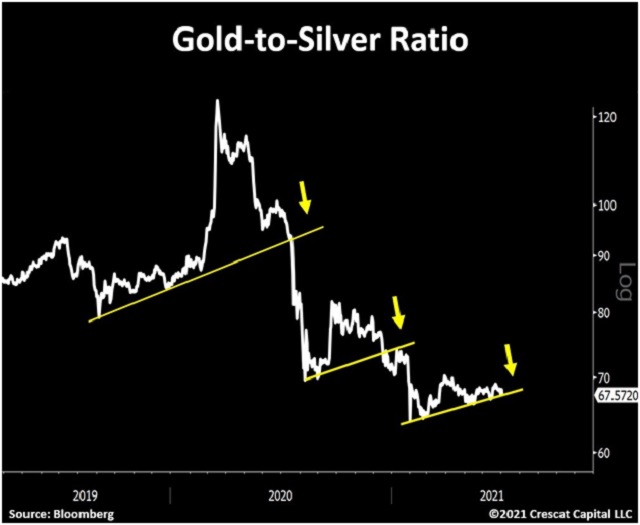
Gold had a spectacular run in the 1970s, and ought to do well in the even more chaotic environment we’re now creating. But silver might do even better. A declining line on the next chart indicates silver outperforming gold (while both rise).
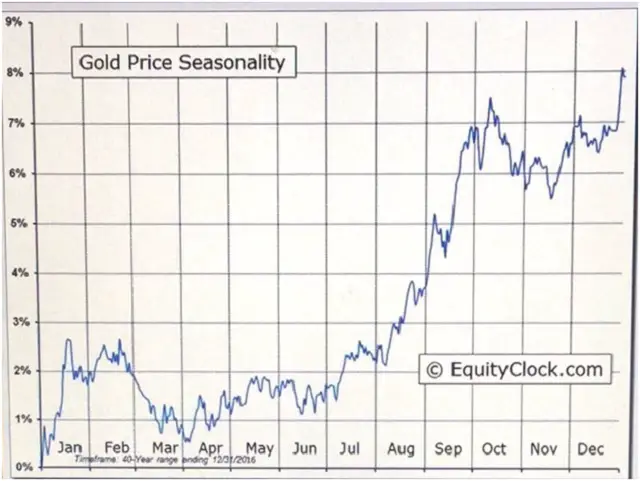
When should the precious metals bull market really get going? Probably not until the current bemusement turns to panic. But in the meantime, seasonality is becoming positive as we enter what are generally the best months of the year.
——————————–



4 thoughts on "Charts For A Crazy World, July 5: Soaring Debt, Negative Interest Rates Set Up Gold’s Next Run"