
Guest Post from the team at Goldmoney.com:
Gold and Silver prices continue to show remarkable strength despite strong headwinds from both real-interest rate expectations and realized real-interest rates. Inflation as reported through the CPI (Consumer Price Inflation) has been above short-term rates for nearly three years. However, with the Fed raising rates at the fastest pace since WWII, short term rates have now finally caught up with reported inflation. This means that realized real-interest rates are now close to zero again, the first time since the beginning of the COVID-19 pandemic (see Exhibit 1).
Exhibit 1: Realized real-interest rates are positive for the first time in 3 years
% 3-month T-Bills – CPI inflation

Source: Goldmoney Research
In our proprietary gold price framework, we have explained in detail that realized real-rates are less important for gold prices than real-interest rate expectations. The markets real-interest rate expectations can be observed via TIPS yields. TIPS (Treasury Inflation Protected Securities) pay a lower nominal yield than nominal Treasury bills, but they compensate the owners for observed inflation (as measured by the CPI). Hence, the yield on 10-year TIPS reflects the market’s expectations on real-interest rates over a 10-year period.
TIPS yields have also collapsed at the beginning of the pandemic when the Fed slashed interest rates. But unlike realized real-interest rates TIPS yields never dropped much below -1%. Even the sky-high inflation in 2022 did little to push TIPS yields lower.
Exhibit 2: Real-interest rate expectations moved sharply lower in early 2020 but never dropped much below 1%
10-year TIPS yields, %

Source: Goldmoney Research
This was mainly because the high observed inflation in 2022 did not have much of an impact on long-term inflation expectations. Implied breakeven inflation in 1-year TIPS rose to 6% in March 2022, but implied breakeven inflation in 10-year TIPS only moved from 2.5% to 3%. And the reason why 10-year inflation expectations moved at all was simply because the market priced in the high inflation over the next 12 months. In fact, the implied breakeven inflation for the 9 years after the first 12 months barely ever moved (see Exhibit 3).
Exhibit 3: Breakeven inflation implied in TIPS yields shows that the market was never too concerned about long-term inflation
%

Source: Goldmoney Research
The Fed’s rate hikes did not just push realized real-interest rates up strongly, but also real-interest rate expectations from -1.2% to as high as 1.5%. This should create strong headwinds for gold prices. However, gold is again trading over $2000/ozt and has been close to its all-time high in recent weeks. This raises the question of what the market is pricing in for gold prices to be that strong despite the headwinds.
One of the more interesting recent developments that we think contributed to gold’s strength despite the rally in real-interest rate is that short-term and long-term interest rates have started diverging. Since the Fed started its aggressive rate hike path in December 2021, both short term rates and long-term rates have been going up in tandem. But then long-term rates peaked in October 2022, while short-term rates have been making new highs over the past days.
Exhibit 4: Short-term rates and long-term rates continue their diverging paths
%, 10-year T-bill (LHS), 3-month (RHS)

Source: Goldmoney Research
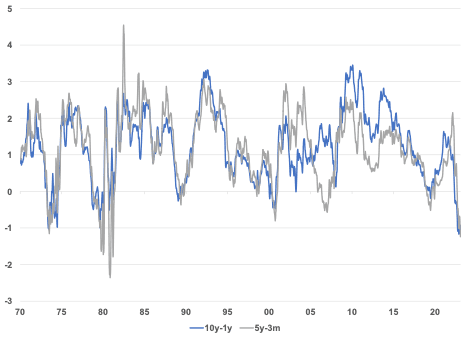
This has led to a deeply inverted yield curve. In fact the 10-year / 1-year spread is the lowest it has ever been. The 5-year / 3-month spread was only lower in the early 1980s as a result of the Volker shock.
Exhibit 5: the yield curve is already steeply inverted
%
Source: Goldmoney Research
It is important to point out that the Fed did not just continue raising rates after the recent banking crisis seemed to have been contained, it also continued QT (quantitative tightening). In our recent report “Has the Fed already pivoted?” (March 27, 2023), we highlighted the Fed’s undoing of two-thirds of the entire QT it had been conducted over the course of almost a year in just two weeks. The Fed started QT in April 2022 and managed to unwind around $600bn until March 2023. When the collapse of Silicon Valley banks sent shockwaves through the financial system, the Fed reacted by buying back around $400bn in assets (see Exhibit 6). The question arose whether this signaled already the end of QT. However, since then, the Fed resumed its asset unwinding. Over the past 3 weeks, the Fed reduced its balance sheet by $120bn, indicating that the bank is determined to continue its hawkish policy.
Exhibit 6: The Fed bought $400bn in assets as a reaction to the recent banking crisis, but has since then resumed QT
$ Million

Source: Goldmoney Research
What does that all mean? It means that while the market is waking up to the fact that the Fed – despite the recent banking crisis and other red flags in the monetary system – remains undeterred in getting inflation under control in the short run, it is increasingly less convinced that this will last over the long run. This can be due to two either of two things:
- The market thinks the banking crisis is indeed contained and Fed will be successful in getting inflation under control relatively soon including a mild and short-lived economic slowdown on the back of the rate hikes and unwinding of the balance sheet. As there is no problem with inflation anymore, the Fed than can adopt a more accommodative monetary policy (lower rates, but not necessarily QE)
- The market thinks the Fed’s actions will cause a massive recession an potentially a larger scale banking crisis, which then in turn will force the Fed to do a U-turn, slash rates back to zero and restart QE. In this scenario, inflation may come down further as the recession unfolds (commodity prices crash, the labor market shifts from very tight to very weak, asset prices collapse), but the monetary action to counter this will lead to much higher inflation down the road
So, which one does the market price in? It depends on the market. We would argue that the Fed funds futures market, the bond market and the equity market all price in the first scenario. The Fed funds future market implies a slightly more dovish rate path than the Fed itself as visualized in its famous dotplot, but overall the expectations are that rates go up in the very short run, peak, and then gradually decline (see Exhibit 7).
Exhibit 7: The Fed funds future market has slightly more dovish expectations than the Fed itself, but overall they look similar
%
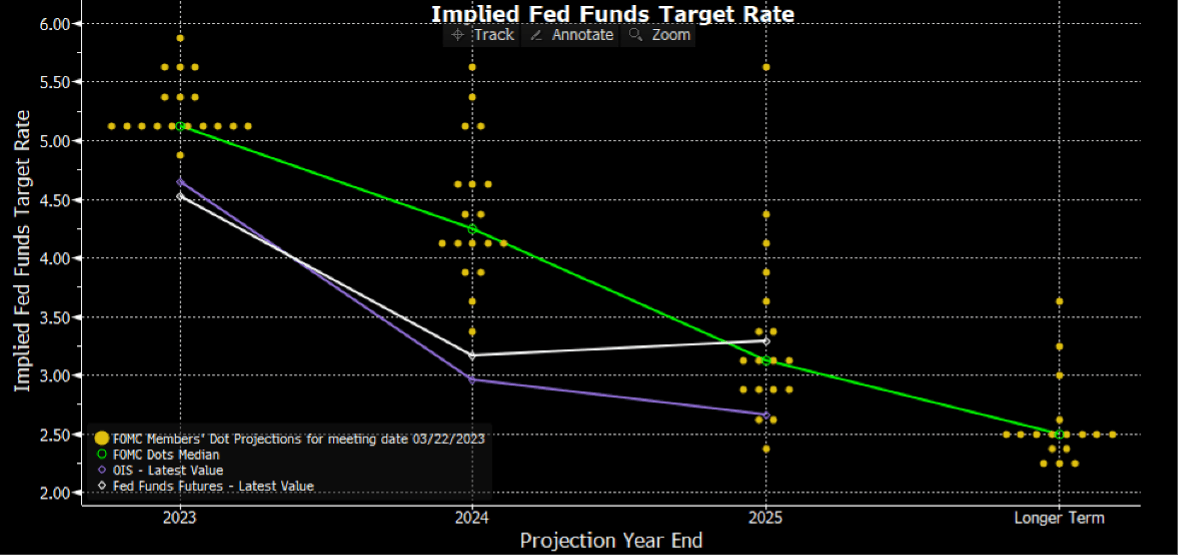
Source: Bloomberg
The gold market, however, seems to price in scenario two. Gold prices imply expected real-interest rates are roughly 2-3% below current levels. That can only happen if the Fed is forced to slash rates drastically again AND that long-term inflation expectations rise.
In our opinion, the most likely scenario is a mixture of both. On the one hand, we agree with the gold market’s prediction that the upcoming recession will not be shallow one, but instead will turn into a steep recession that will push the Fed to once again slash rates to zero (or maybe even NIRP for the first time) and adopt some form of QE. On the other hand, we don’t think that this necessarily means that real interest rates and real interest rate expectations are only going down from here. We think it’s more likely that we see real-interest rates spiking first (and energy prices crashing).
We can look at the 2007-2008 recession. 10-year TIPS yields went from 1% to over 3% just as the Great Financial Crisis reached its fever point. This happened because long-term inflation expectations crashed. Hence, even as long-term rates declined in tandem with prompt rates, TIPS yields increased. Simultaneously, longer dated oil prices crashed from $145/bbl to $30/bbl. As a result, gold prices dropped from $950/ozt to $700/ozt (see Exhibit 8).
Exhibit 8: As the great financial crisis unfolded, TIPS yields spiked and gold crashed
$/ozt (LHS), % (RHS) inversed axis

Source: Goldmoney Research
We all know what happened right after that. The Fed slashed rates to zero and introduced QE for the first time. This pushed real rates sharply lower just as energy prices recovered. The Fed followed up with several rounds of QE, some carried a different name. And as a result, gold went from $700/ozt to $1880/ozt in 2011.
Arguably, QE was a new thing in 2008, and nobody knew that the Fed was willing to slash rates to zero and keep them there for 10 years. Thus, part of what is going on today is probably also the gold market’s pricing in that once the recession gets really bad, the Fed will do the same again. The idea is that people should know now that the Fed’s action will counter the forces that historically had a negative impact on gold prices, so why sell if you just have to wait for the Fed to do its thing. In other words, the expectations are that the deflationary forces that typically unfold in the early parts of a recession will not lead to a decline in long term inflation expectations this time but an increase. However, we would argue that this requires that everybody will understand this when the recession hits.
Only time will tell how this plays out. We remain cautious in the short run and very bullish medium to long term.