
“The market is not a crystal ball, but a barometer.”
~ In Gold We Trust report 2025, Incrementum AG
Written by Bryan Lutz, Editor at Dollarcollapse.com:
Gold sits around $4,500 an ounce this week.
That is down from the January 28th record of $5,589, but still up roughly 35% on the year…
The bull market that got us here started back in 2020, when gold first cleared its old 2011 highs and never looked back. Incrementum’s In Gold We Trust report calls this “The Big Long,” the second half of what they describe as the golden decade.
In their recently released 2025 report, the team writes that the current gold bull market has already picked up speed, but that we are still a long way from the mania phases of past peaks. Their base-case model still points to $4,800 by 2030. The tail-risk number is $8,900.
So if this is a bull market, the obvious question is: where exactly are we in it?
For that, we turn to a framework older than the Federal Reserve itself.
What Is the Dow Theory?
Charles Dow developed the foundational principles of technical analysis in his Wall Street Journal editorials over a century ago. The market, he argued, moves in three phases.
First comes the accumulation phase. This is when the smart money buys without fanfare while the public still hates the asset. Think of the Economist in January 2022: “Why gold has lost some of its investment allure.” Or the Wall Street Journal that September: “Gold loses status as haven.”
Second comes the public participation phase. Prices trend higher, the trend becomes obvious, and the crowd piles in. This is the longest phase, and it is where momentum lives.
Third comes the distribution phase. The mania arrives. Your cab driver gives you gold tips. The smart money that accumulated at the bottom hands its position to the latecomers who waited for Goldman’s blessing, and then the top is in.
That is the logic behind the chart Incrementum built. Relative strength is the market’s voice, and it tells you which phase you are sitting in if you read it right.
Where We Are in the Gold Bull Market
Incrementum’s read, illustrated below, places us in the back half of the public participation phase.
Watch a consensus form in real time. Here it is:
“Goldman raises year-end gold forecast to $5,400 an ounce” (Bloomberg, Jan 21, 2026)
“JP Morgan sees year-end 2026 gold price at $6,300 per ounce” (Reuters, Feb 25, 2026)
“Wells Fargo doubles down on gold price despite slump” (Mining.com, Mar 29, 2026)
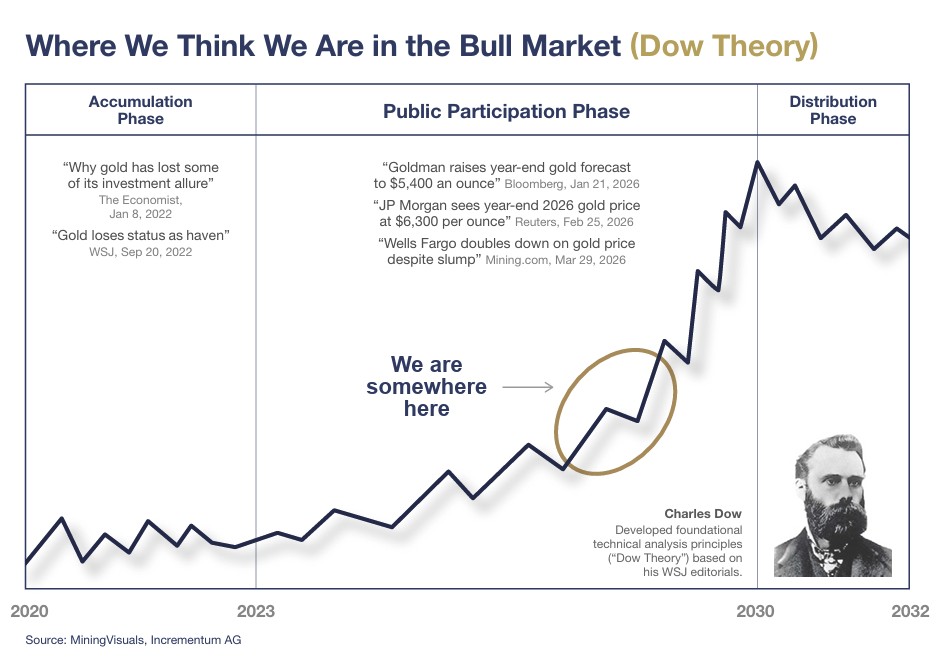
Where We Think We Are in the Bull Market (Dow Theory). Source: MiningVisuals, Incrementum AG.
Along with those headlines are big banks now publishing gold targets. Three years ago the same institutions were writing gold’s obituary.
That shift, from “gold loses status as haven” to “$6,300 by year-end,” is the public participation phase, on schedule.
But notice what is missing. There are no taxi drivers yet. No gold ETF ads during the Super Bowl. No relatives asking how to buy bullion at Thanksgiving.
There is a late stage in every bull market when everyone you know suddenly owns the asset. That has not happened. The distribution phase, the mania, is still ahead of us.
Gold Versus Dow: The Ratio That Matters
Here is the chart that matters most.
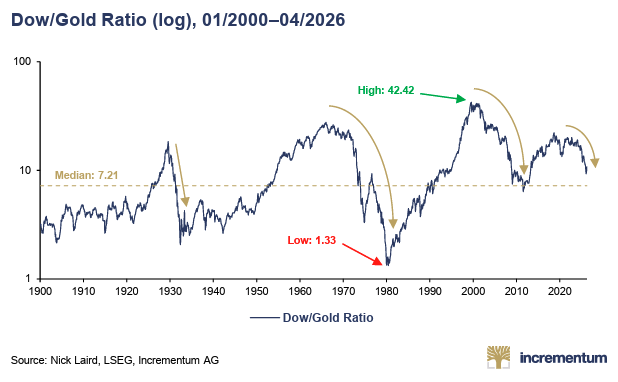
The Dow/Gold ratio measures how many ounces of gold it takes to buy the Dow. When stocks are loved and gold is hated, the ratio runs high. When the reverse is true, it collapses.
The ratio hit 42.42 in 2000, at the peak of the dot-com bubble. It bottomed at 1.33 in 1980, when gold was the only thing anybody wanted. The long-run median is 7.21.
Today we are sitting just under 10 and rolling over hard.
We are barely below the median and falling. If history rhymes, this ratio has a long way to run before gold is overvalued against stocks.
The 1980 low of 1.33 is what a real gold mania looks like. We are nowhere near it.
Basically, we are watching a trip from an overvalued stock market to an overvalued gold market, and we are only in the early innings.
Conclusion
So where are we in the gold bull market?
According to the Dow Theory, we are deep into public participation and have not yet touched distribution. The banks have arrived. The public has not. The Dow/Gold ratio sits near its century-long median rather than its extreme.
That is the rare thing: a trend that is obvious and still has room to run.
The mania phase is still out there. When it comes, you will not need a chart to find it. Your barber will tell you.
Until then, the smart money does what it always does in the second act.
It is accumulating.