
Written by Bryan Lutz, Editor at Dollarcollapse.com:
De-dollarization is usually told as a story about summits, sanctions, and which currency might dethrone the dollar next.
The 2026 In Gold We Trust report shares a number of different perspectives on gold, here’s one that focuses on de-dollarization as a denominator problem.
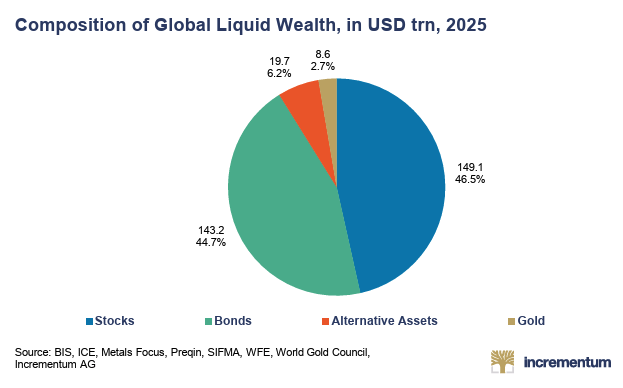
Here is the pool. Global liquid assets total roughly $321trn. Equities account for 46.5% of that. Bonds account for 44.7%…
Gold held by investors accounts for 2.7%.
That number is the whole argument, so the rest of this comes down to two questions. What happens to the price if that 2.7% drifts toward the allocations the report models. And where does the money to fund the shift actually come from.
Here is the composition of global liquid wealth as the report measures it:
Now the part that makes the sliver matter. Gold supply is close to fixed in the timeframes that count. Above-ground stock grows about 1.8% a year, the pace of the last decade, and production cannot be scaled up on command no matter what the price does. The pool of financial assets on the other side compounds far faster.
That mismatch sets up the asymmetry the report spells out directly. Foreign investors hold roughly $57T in US financial assets. A reallocation of just 0.5% of that sum into gold works out to $273.6B, which at current prices is roughly 2,500 tonnes of metal. Measure that against annual supply growth of 1.8% and the conclusion follows on its own. The gold market is large and liquid, but it is small relative to the asset base that could feed into it. Small shifts in allocation produce outsized effects on price.
In other words, the more Central Banks print money, the opportunity there is for higher asset allocations into gold.
The formula is plain:
Gold price equals global liquid assets times the target allocation, divided by the quantity of investment gold available to hold.
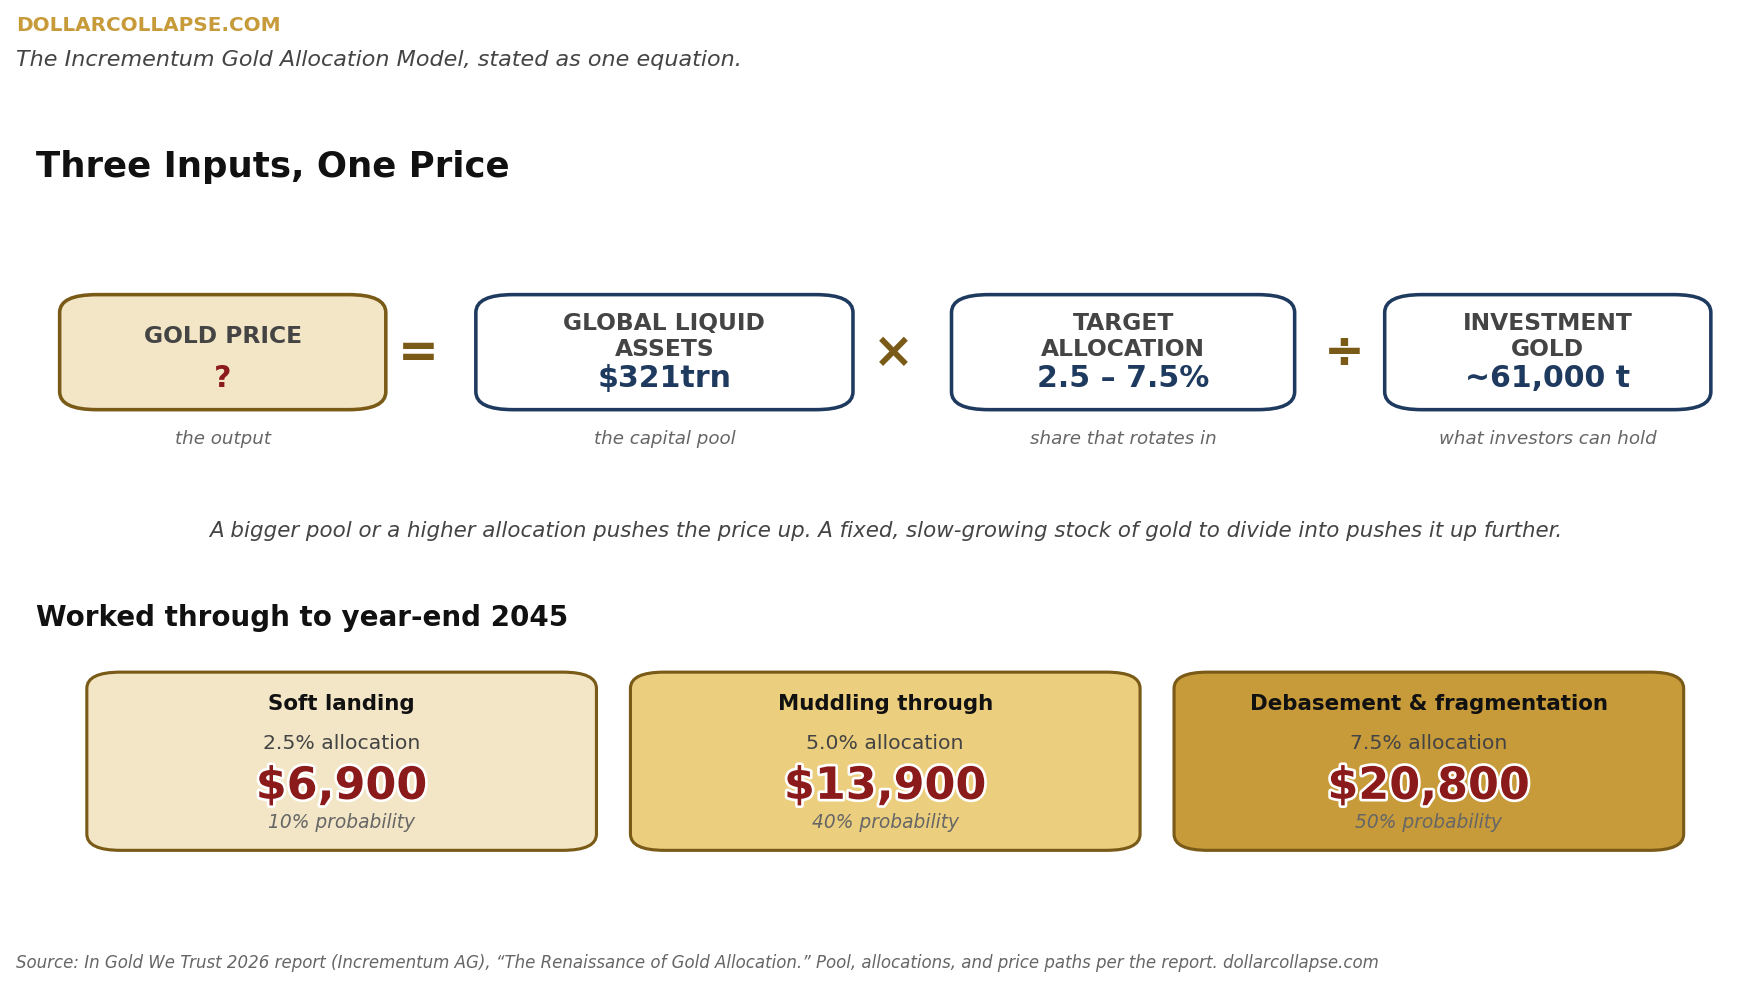
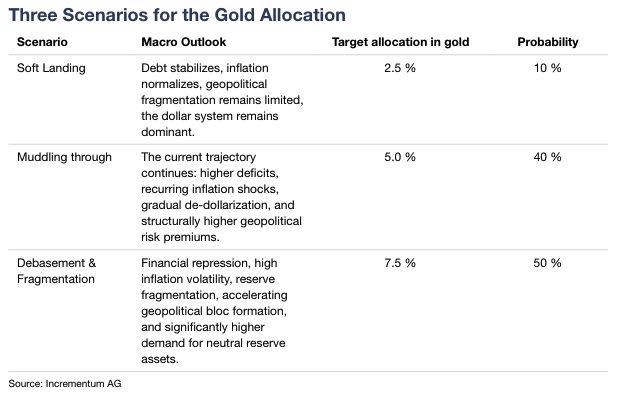
Three scenarios, three target allocations, three outputs.
A 2.5% allocation produces a gold price around $6,900.
A 5.0% allocation produces $13,900.
Or, a 7.5% allocation produces $20,800.
OK, so we lower the hype-level here…
The soft-landing case that leaves gold at 2.5% is treated as the 10% tail. The muddling-through case at 5.0% carries a 40% weight. The debasement-and-fragmentation case at 7.5% carries 50%. The model also assumes the asset pool keeps growing at its long-run pace of about 6.1% a year, roughly in line with money supply growth since 2000, so the denominator expands alongside the allocation.
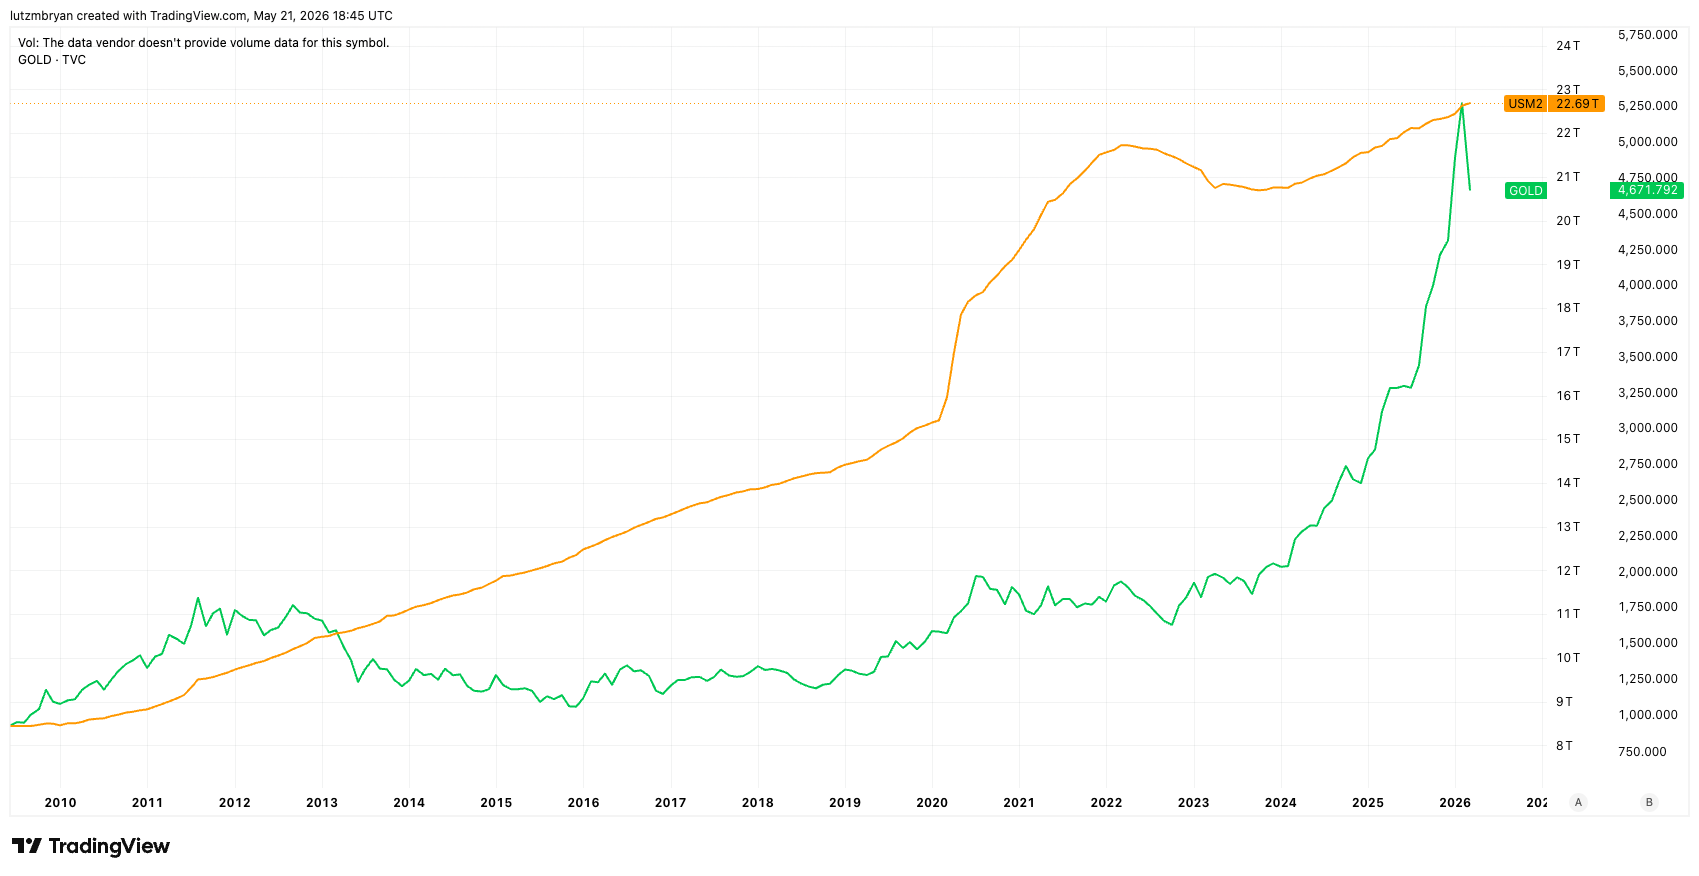
And so far, gold is now tracking with US M2 Supply.
Which leaves the last question, and it is the one that connects all of this back to de-dollarization. A reallocation of this size has to be funded from somewhere, and the source is not idle cash sitting on the sidelines. The cash comes from:
The reallocation will not be funded by idle cash. It comes out of “the bedrock of institutional portfolios for forty years”: nominal government bonds.
A rising gold allocation and a shrinking government-bond allocation describe the same flow of money seen from two sides. What moves into the 2.7% sliver of gold comes out of the 44.7% bond block, and a large share of that bond block is dollar-denominated sovereign debt.
That is what de-dollarization looks like on the balance sheet rather than in the headlines. It is a line item migrating from one column to another, 0.1 – 0.2 percent at a time.
None of this requires believing in a collapse, but… in the end it demonstrates that the world wants a new unit of account. Something other than the USD. A small and plausible shift in allocation, applied to a supply that barely grows, produces a large move in price. The thing most people debate over is time… The single open variable is time, whether the shift plays out over the full twenty years the model uses or arrives faster.
Small percentage shifts in allocation over next several months, years, or decade will show us, only in hindsight, where the USD was already headed.