Yesterday I noted that Japan was on the verge of a debt crisis.
By quick way of review…
After 30+ years of monetary interventions, the Japanese Yen is on the verge of entering a free-fall. Last week the Yen came dangerously close to breaking below critical support. A break below this line would open the door to an all-out collapse down to levels not seen since 1990.

Japan is desperate to stop this from happening, resorting to larger and larger interventions in the currency markets. However, the problem with this is that in order to buy Yen, the Bank of Japan (BoJ) has to sell assets to free up cash. And the assets Japan has been selling are U.S. Treasuries.
To be clear, we’re not talking about a small amount of money, either. Last Thursday alone the BoJ spent a RECORD $52 BILLION in a single day.
Obviously, the U.S. doesn’t want the largest international holder of Treasuries dumping them. So last week the U.S. Treasury actively intervened in the Yen for the first time since the Asian Financial Crisis of 1998.
The multi-trillion-dollar question (trillions of dollars in capital are priced based on where the yen and Japan bond yields trade) here is “was that enough to calm things down?”
The answer appears to be a resounding “NO!”
As ZeroHedge notes, Japan just staged one of its worst bond auctions in decades. Without getting too technical (bond auctions are extremely complicated), the following happened:
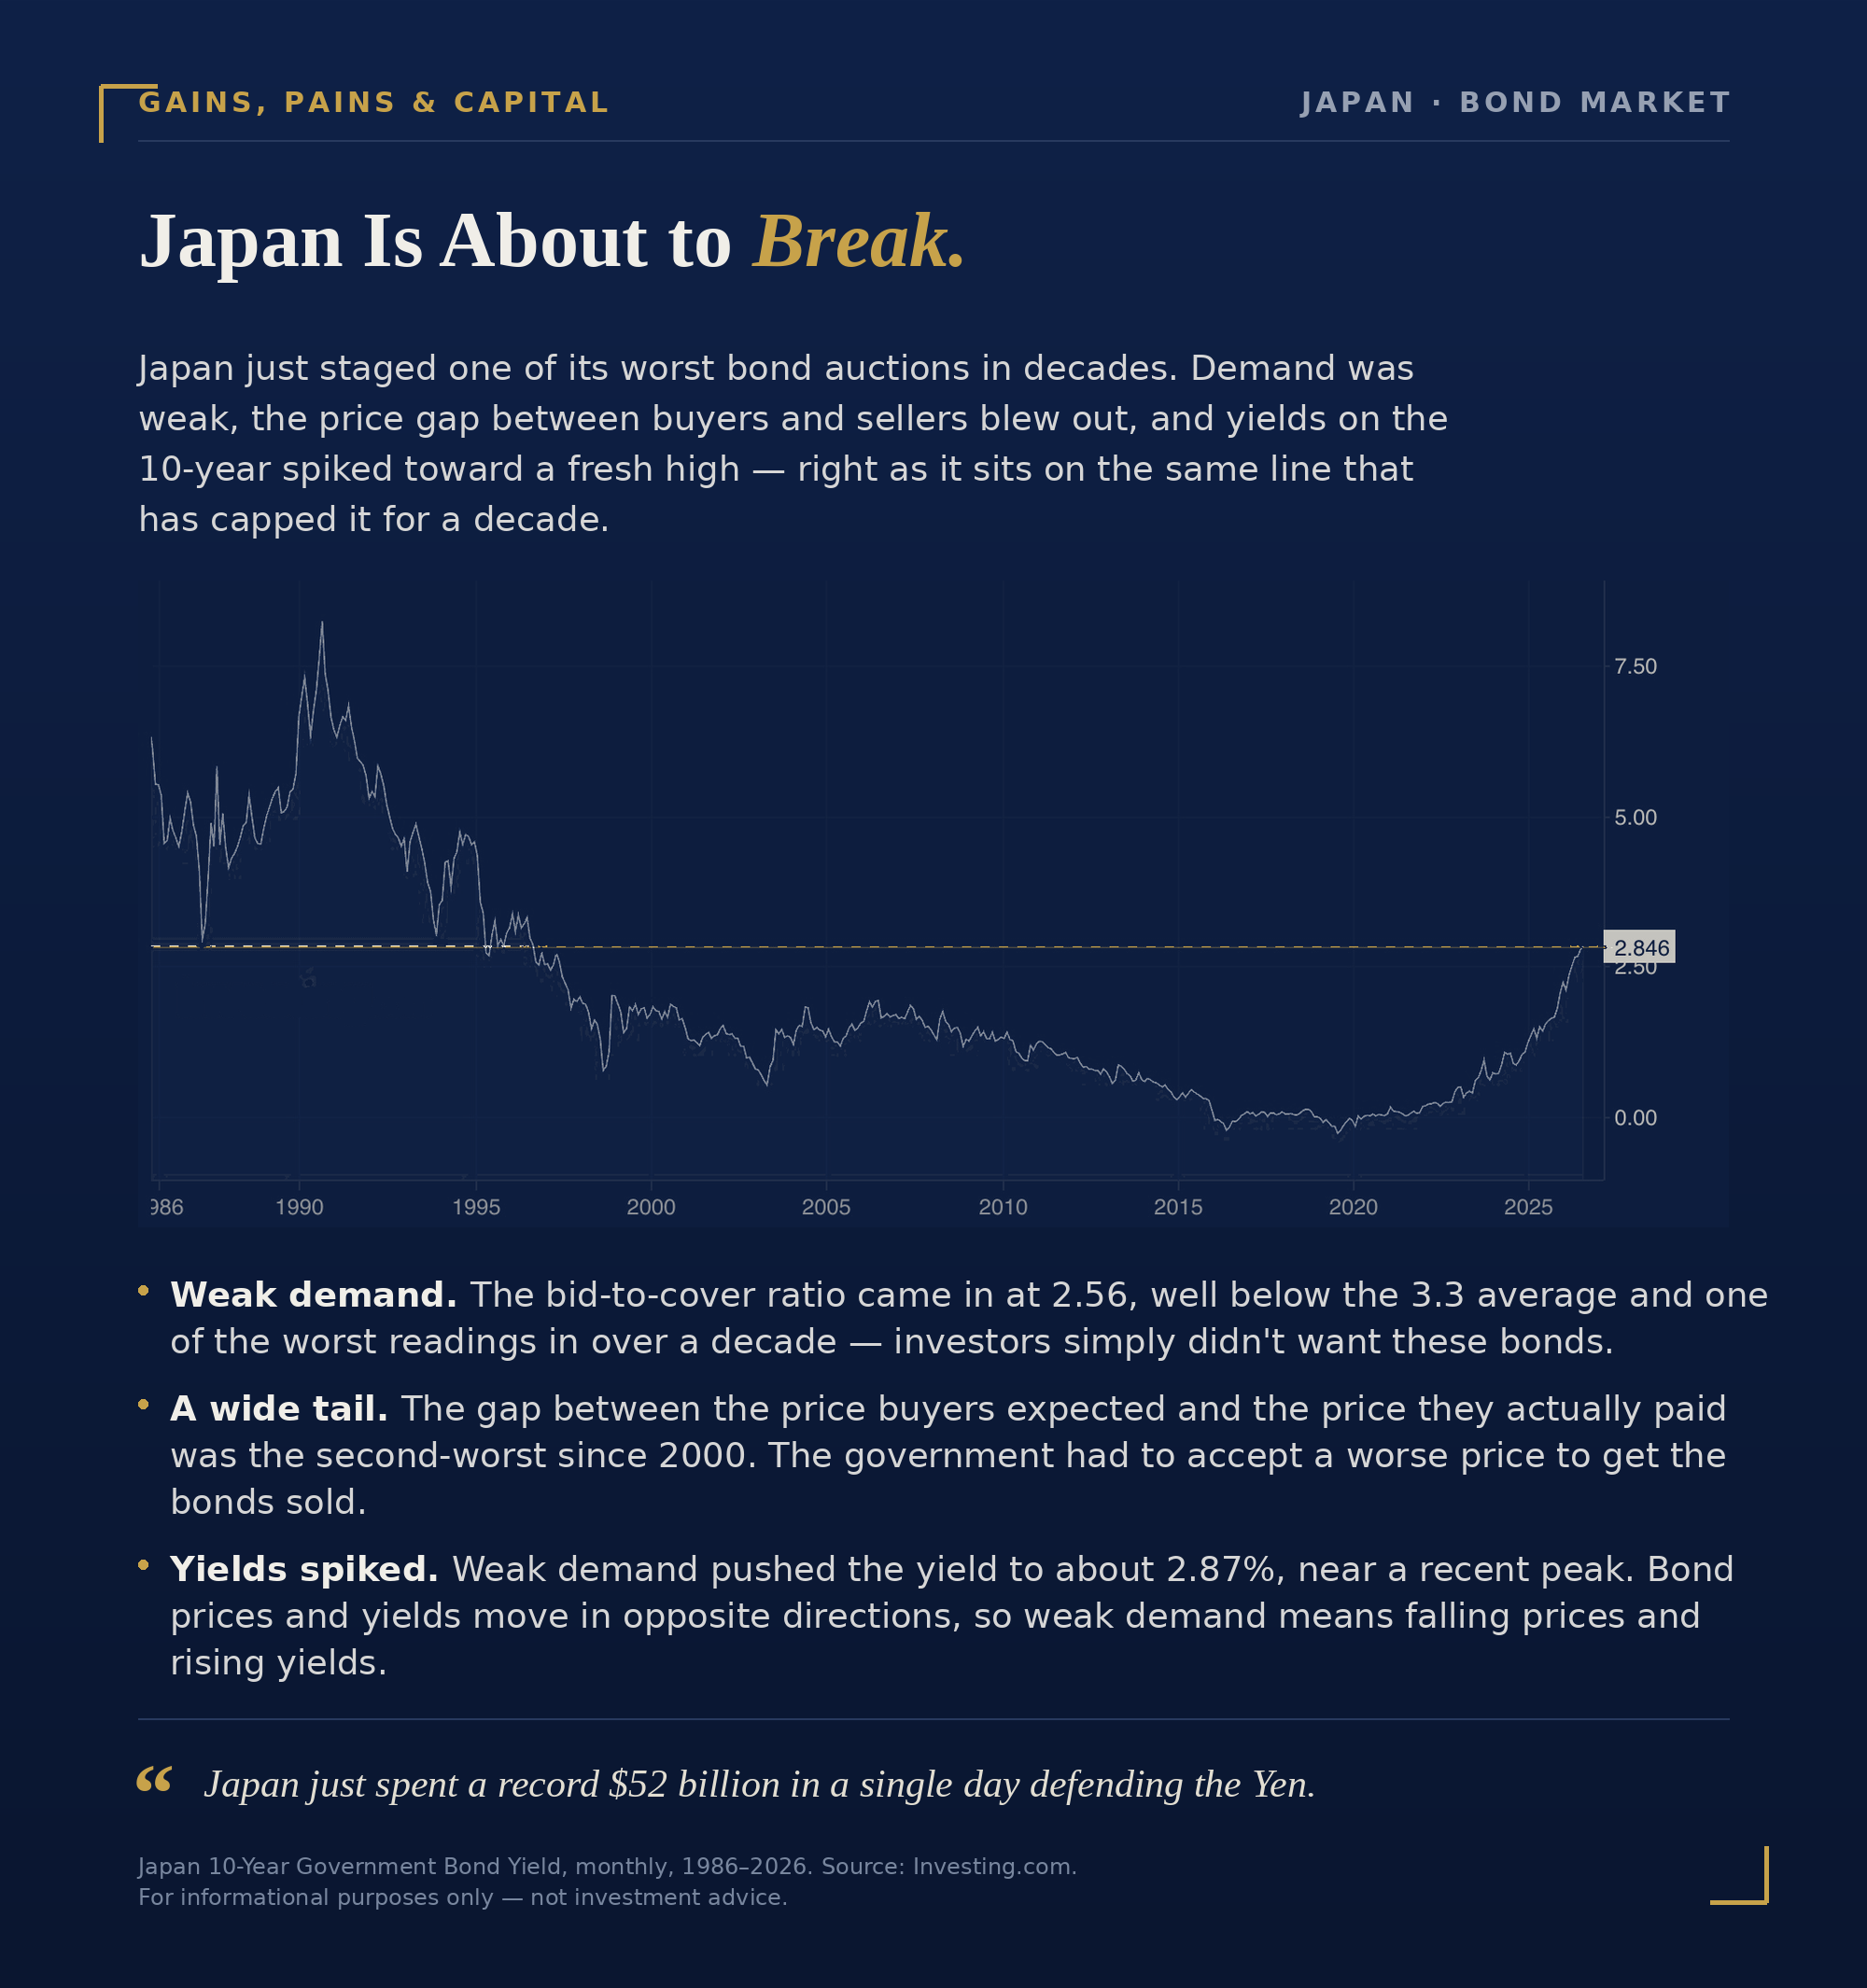
- Weak demand: The “bid-to-cover ratio” (how many buyers showed up per bond available) was 2.56, way below the normal average of 3.3 and one of the worst readings in over a decade. This tells us that investors didn’t want these bonds much.
- Big “tail”: The gap between what buyers expected to pay and what they actually had to pay was the second-worst since 2000. Translation: the government had to accept a worse price than hoped to get the bonds sold.
- Yields spiked: Because demand was weak, the yield (interest rate) on those bonds jumped to about 2.87%, nearing a recent peak. Bond prices and yields move opposite each other, so weak demand = falling prices = rising yields.
As the below chart shows, the yield on Japan’s all-important 10-Year Government Bond is going vertical. The end game for Japan’s gargantuan debt bubble is coming…
In terms of preparing for a market collapse, I rely on a proprietary indicator that has triggered before every major meltdown in the last 50 years. This signal caught the 1987 crash, the Tech Crash, the Great Financial Crisis and more.
We detail this trigger, how it works, and what it’s saying about the markets today in How to Predict a Crash.
Normally we’d sell this report for $499, but in light of its recent warning, we’re making 99 copies available to the investing public.
To pick up one of the last copies…
Graham Summers, MBA
Chief Market Strategist
Phoenix Capital Research