
Guest Post from Peter C. Earle at the American Institute of Economic Research:
n an article last week, I referred to the combination of rapidly slowing US economic growth and persistently high inflation as “stagflation lite.” Despite receding from the highs of last summer, inflation remains near its highest levels in decades as disinflation (particularly in services) has recently slowed to a crawl. Meanwhile, US economic growth has been on a downward trajectory over the past few years, including a brief recession in the middle two quarters of 2022.
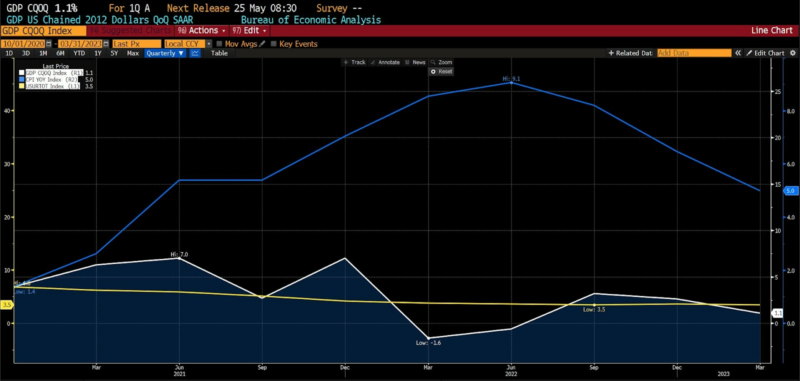
What’s currently missing from the full stagflationary scenario is elevated unemployment. The Bureau of Labor Statistics reported the U-3 US unemployment rate as 3.5 percent in March 2023, which is near historic lows. Indeed, low employment has been a thorn in Fed officials’ side since they began hiking short-term rates in March of 2022. The below chart depicts the current, stagflation lite conditions: high inflation (March 2023 year-over-year headline CPI at roughly 5 percent), declining economic growth (1st quarter 2023 US GDP at 1.1 percent), and U-3 employment at 3.5 percent.
Could a full stagflationary episode evolve from this? It’s possible that one already is, according to two sources of data.
First, a look at unemployment data on a state-by-state basis. Tracking the 4-week, year-over-year percentage changes in initial filings for unemployment, 24 of 51 states (50 states plus Washington DC) are showing an average 10-percent or greater increase in those filings over the period from mid-March 2023 to mid-April 2023.
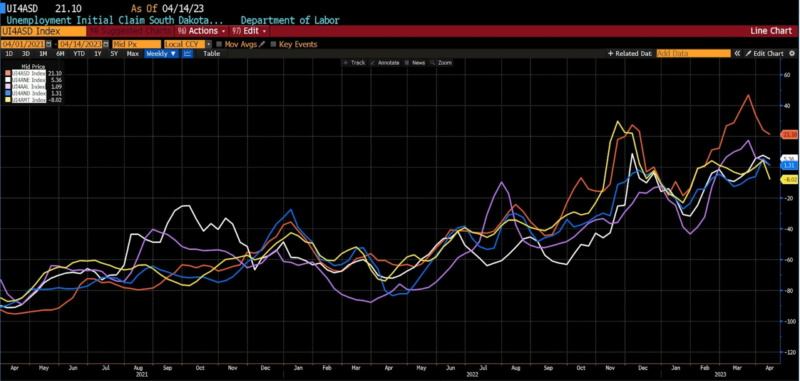
The ten US states with the lowest unemployment rates, as of mid-April 2023, include the following: South Dakota (1.9 percent), Nebraska (2.1 percent), North Dakota (2.1 percent), Alabama (2.3 percent), Montana (2.3 percent), New Hampshire (2.4 percent), Utah (2.4 percent), Missouri (2.5 percent), Wisconsin (2.5 percent), and Florida (2.6) percent. Below are the recent trends in initial unemployment filings in those low-unemployment-rate states.
Initial Unemployment Claims in High Employment States: South Dakota, Nebraska, Alabama, North Dakota, and Montana (April 2021 – April 2023)
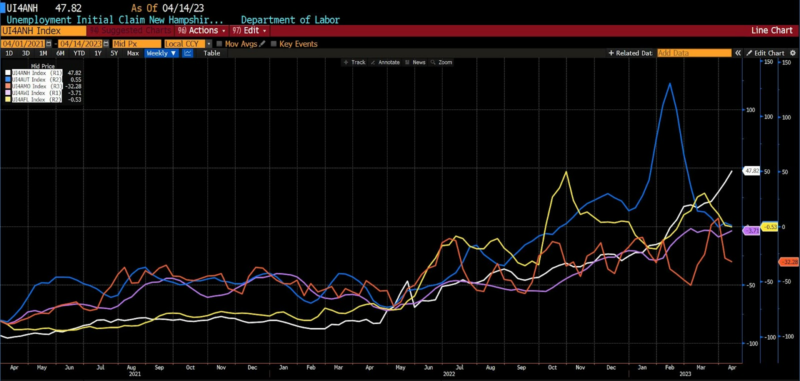
Initial Unemployment Claims in High Employment States: New Hampshire Utah, Missouri, Wisconsin, and Florida (April 2021 – April 2023)
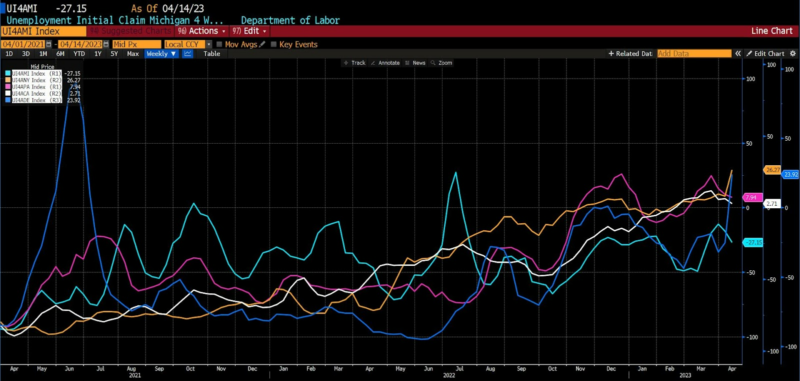
The ten US states with the highest unemployment rates (again, as of mid-April 2023) include: Michigan (4.1 percent), New York (4.1 percent), Pennsylvania (4.2 percent), California (4.4 percent), Delaware (4.4 percent), Illinois (4.4 percent), Washington (4.5 percent), District of Columbia (4.8 percent), and Nevada (5.5 percent). Below are the trends in initial unemployment claims in the highest unemployment states.
Initial Unemployment Claims in Low Employment States: Michigan, New York, Pennsylvania, California, and Delaware (April 2021 – April 2023)
Initial Unemployment Claims in Low Employment States: Oregon, Illinois, Washington, District of Columbia, and Nevada (April 2021 – April 2023)
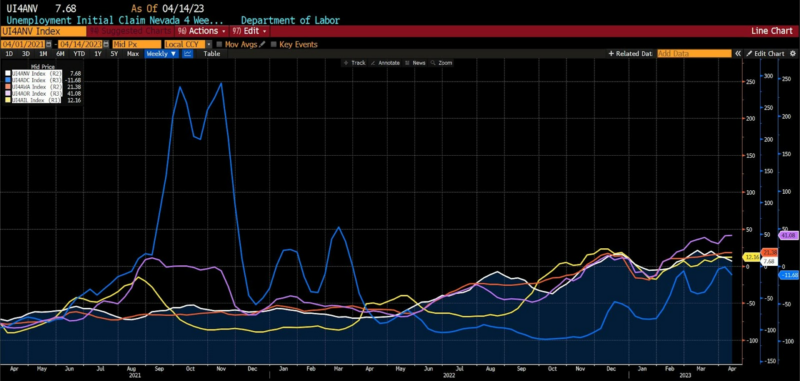
In most of the ten US states with the lowest and highest unemployment rates, initial claims are trending both higher and at an accelerated rate over the past three to six months. This is at odds with the current publicly available federal unemployment data.
A similar progression is evident in WARN (Worker Adjustment and Retraining Notification Act of 1988) data. Generally speaking, although some states have their own versions of it, the Act requires firms with 100 or more employees to give employees at least 60 days notice of impending layoffs or facility closings. Looking at the aggregate number of jobs accounted for in recent WARN filings across 39 US states, a similar pattern to what’s happening in initial claims is unambiguously clear.
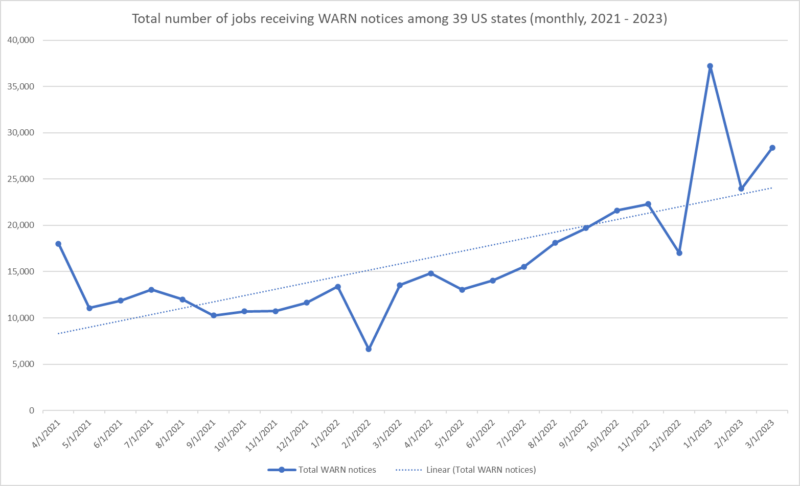
Federal and state unemployment data draw from different sources. As depicted here, state filings provide a more comprehensive “under the hood” view of developing economic trends than that which is available and published by loftier government departments and agencies.
On the basis of both initial claims for unemployment (in both high and low employment states) and WARN filings (in 39 US states), unemployment is rising rapidly. More importantly, those increases are not currently being captured in the reports of the Bureau of Labor Statistics (BLS) or other federal sources.
With rigidly elevated inflation and shrinking output, it’s not an exceptionally daring proposition to predict that job losses will follow. And none of this necessarily anticipates job losses on par with the worst recessions of the last few decades. Should these tendencies continue, though, they would fulfill the third and currently missing criteria of an outbreak of stagflation. Inflation could, over the remainder of this year, return to the levels the Fed seeks. Or the Fed could back away from its stated commitment to the return to a 2-percent long-run price level target, perhaps even choosing instead to lower rates in order to artificially boost employment, induce business expansion, and lift financial asset prices. In any case, the US economy looks to be pointed in a troubling direction. A direction which, let no one forget, finds most of its nascence in reckless and politically motivated public health, fiscal, and monetary policies now three years back.
Guest Post from Peter C. Earle at the American Institute of Economic Research.