Written by Bryan Lutz, Editor at Dollarcollapse.com:
So, M2 money supply just hit an all-time record of $22.41 trillion in December 2025.
Not during a pandemic. Not during a world war. Just… quietly. On a random Tuesday.
And nobody’s talking about it.
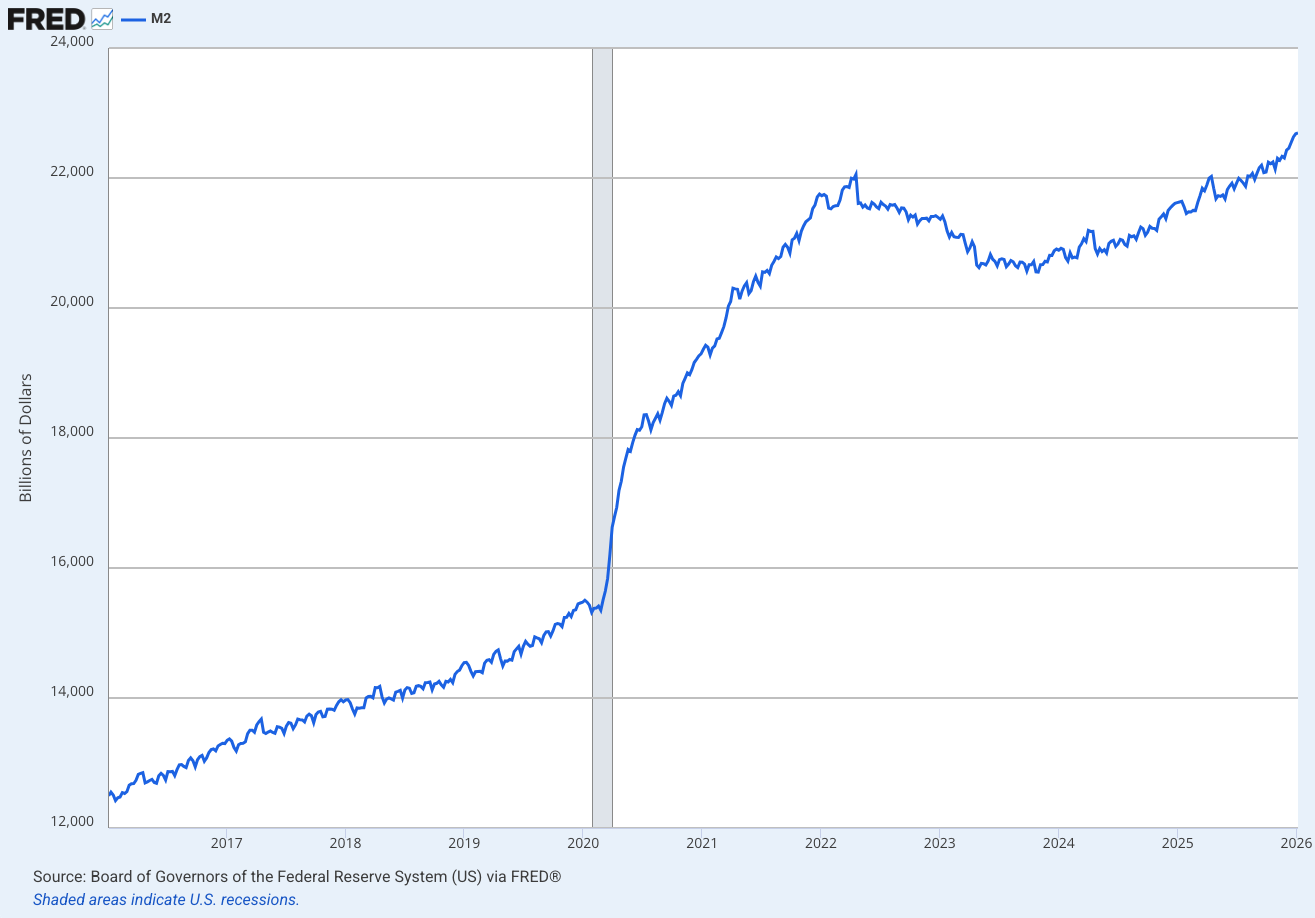
That number surpassed the previous peak set during the 2020-2022 money-printing binge. You remember, the one that gave us 9% inflation and made your grocery bill feel like a car payment. Year-over-year growth is now running around 4.9% with the Fed officially ending quantitative tightening in December. And just last week, the January 2026 CPI came in at 2.9%, ticking up from December’s 2.7%.
To be sure, CPI will most likely continue to increase, along with felt inflation in almost every sector.
The Numbers They’re Not Talking About
Here’s what’s going on behind the curtain.
The Federal Reserve spent the better part of 2022 through 2025 pretending it was serious about shrinking the money supply. Quantitative tightening was supposed to be the hangover cure after the $6.2 trillion bender from 2020-2022. It was supposed to supply a “soft landing.” That was the plan anyway, but I don’t think the plane ever landed.
Instead, M2 bottomed out in early 2024, turned around, and has been marching higher ever since. By December 2025, it broke through to new all-time highs. The Fed’s balance sheet reduction program? Finished. Done. They pulled the plug in December. Now rates are sitting at 3.50-3.75%, and we’re not looking at another cut anytime soon.
So we’ve got a growing money supply, rates on hold, and prices starting to creep higher again. That’s the setup. And when you understand the lag, the future looks worse for the dollar, and better for hard assets like gold and silver.
The 12-18 Month Lag Is the Whole Story
This is the part that most people get wrong about inflation. They think M2 goes up and prices go up at the same time. That’s not how it works.
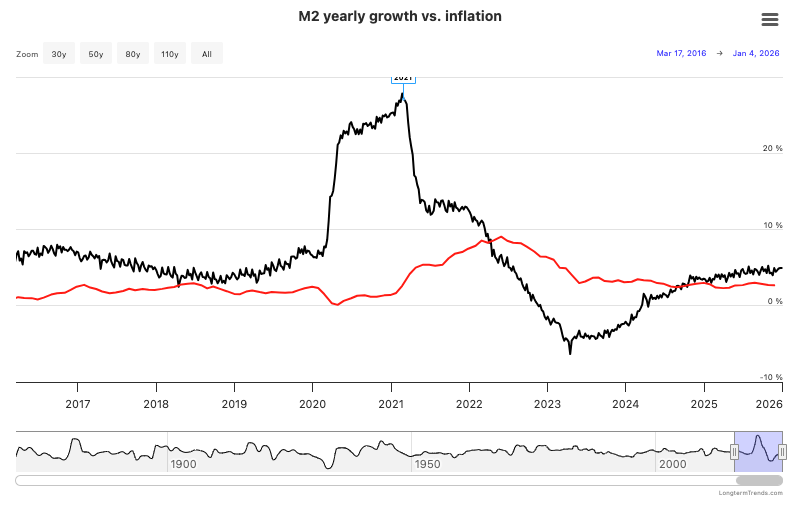
The St. Louis Fed’s own research shows that M2 growth leads consumer price inflation by roughly 12 to 18 months. Think of it like a slow-moving wave. You throw a rock into the water and the ripple doesn’t hit the shore right away. It takes time.
img: https://www.longtermtrends.com/m2-money-supply-vs-inflation/
The M2 growth acceleration started picking up steam around mid-2024. Do the math on that 12-18 month lag and it puts the inflationary pressure arriving right about… now. Through mid-2026.
RBC Economics is already forecasting core CPI to hit 3% by Q2 2026 as tariff passthrough works its way into consumer prices. And that’s the official number. We all know the official number is the polite version.
Which brings us to a question worth asking:
Which inflation number do you trust? The government’s CPI, or your own grocery receipts?
The Mises Institute ran a piece this week comparing official CPI data with the actual grocery receipts. The tik-tok shopper’s receipts show price increases well above what the Bureau of Labor Statistics reports.
@zoedippel $155 to $500 is CRAZY!!!!! WHAT?!? No wonder we are all struggling to survive out here. 🤣 Our parents had it so good!!!! #fyp #viral #heb #groceryshopping @H-E-B ♬ original sound – zoedippel
The gap between what the government says inflation is and what your wallet says inflation is — it’s wide, and it’s getting wider.
CPI says 2.9%. Your shopping cart says something much different.
The Real-World Evidence Is Everywhere
You don’t need a PhD in economics to see this playing out. Just look around.
Used vehicle prices jumped in January and are expected to climb further during the record tax-refund season. If you’ve tried to buy a used truck lately, you already know. The Wall Street Journal ran a piece this week:
“Why Inflation May Be About to Come in Hot.”
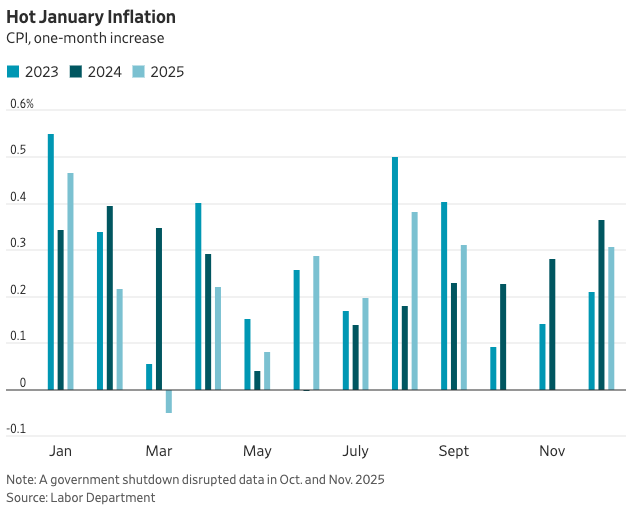
“January’s inflation numbers land on Friday and the consensus calls for a moderate 0.3% monthly rise in consumer prices that cools the annual inflation rate to 2.5%.
Still, many on Wall Street are bracing for an unpleasant surprise. In recent years, inflation in January has tended to come in relatively hot. Last year, the consumer-price index, which tracks the cost of a basket of goods and services, rose more in January than in any other month. The same thing happened in 2023. January wasn’t the hottest month for inflation in 2024, but it was close.
If that happens again, it will be seen as proof that companies are passing President Trump’s tariffs on to consumers. Some Federal Reserve officials have cited this possibility as a reason to be cautious about further interest-rate cuts…
…The Labor Department’s Bureau of Labor Statistics, which compiles the CPI, seasonally adjusts the results to erase patterns that recur each year. In other words, if prices always rise more in January, that shouldn’t show up in the seasonally adjusted CPI.”
Meanwhile, rising prices over the past two decades are showing their results.
Beef prices are still elevated. The U.S. beef cow cycle is at a low point, which means supply is tight and steak prices aren’t coming down anytime soon.
Meanwhile, Americans borrowed a record amount to pay for Christmas 2025. The typical U.S. worker has $955 saved for retirement according to CBS News. Read that number again. Nine hundred and fifty-five dollars.
People are broke, borrowing more, and the cost of everything is about to go up again. That’s the real economy in February 2026.
The Fed Is Trapped, and M2 Tells You Why
Here’s where this gets really interesting from a dollarcollapse.com perspective.
The Fed can’t tighten. National debt is above $36 trillion. Interest payments on that debt are already one of the largest line items in the federal budget. Push rates much higher and the debt service costs become unmanageable. The government would essentially be borrowing money to pay interest on the money it already borrowed. A debt spiral.
But the Fed can’t ease either. Inflation is re-accelerating. Cut rates now and you pour gasoline on a fire that’s already smoldering.
So what happens? M2 keeps growing. It has to. The system requires new money creation just to service the existing debt. It’s the same debt-debasement cycle that has destroyed every fiat currency in history.
The political pressure is building too. Kevin Warsh’s call for a new Fed-Treasury accord stirred up the $30 trillion bond market this week. The White House says it wants a strong dollar, but investors aren’t buying it — literally. China is reportedly urging its banks to reduce U.S. Treasury exposure. Gold just overtook the U.S. dollar in global central bank reserves for the first time.
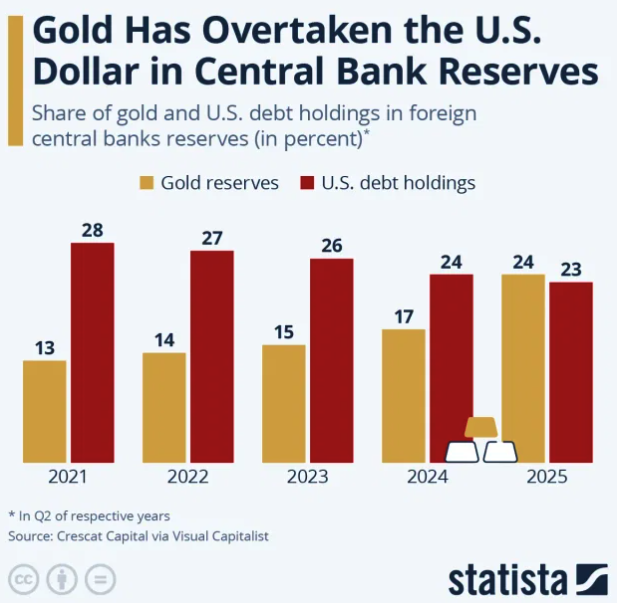
When central banks around the world are quietly dumping your currency and stacking gold instead, that tells you everything you need to know about where this is heading.
The Verdict
The Fed declared victory over inflation in 2024. M2 is telling a different story. So it’s filing an appeal.
At $22.4 trillion and climbing, the money supply is telling a story that the official CPI numbers haven’t caught up to yet. But they will. They always do. The 12-18 month lag is a clock, and it’s ticking.
If you’re sitting on dollars and hoping prices will come back down, you might be waiting a long time. The money has already been created. It’s already in the system. The only thing we have to wait on now is how fast it shows up in prices.
References:
- Federal Reserve H.6 Money Stock Measures, December 2025 — M2 at $22.41 trillion (seasonally adjusted). federalreserve.gov
- FRED M2 Money Supply (M2SL), updated January 27, 2026. fred.stlouisfed.org
- Bureau of Labor Statistics, Consumer Price Index — December 2025 CPI-U at 2.7% YoY; January 2026 at 2.9% YoY. bls.gov
- RBC Economics, “Deep Dive: How to Monitor US Inflation in 2026” — Core CPI forecast to peak at 3% in Q2 2026. rbc.com
- Daniel Lacalle, “Excessive Money Supply Growth Creates Secular Stagnation” — M2 YoY growth at 4.53%, global M2 at ~$123 trillion. dlacalle.com
- BabyPips, “Global M2 Money Supply: The Long-Term Liquidity Indicator” — M2-to-inflation lag of 12-18 months. babypips.com
- Mises Institute, “Which Should You Believe: Official CPI or Zoe Dippel’s Grocery Receipts?”
- Wolf Street, “Here We Go Again on Inflation: Used Vehicle Prices Jump in January”
- Wall Street Journal, “Why Inflation May Be About to Come in Hot” — February 9, 2026
- CBS News, “The typical U.S. worker has $955 saved for retirement” — February 7, 2026
- Money Metals, “Americans Borrowed a Lot to Pay for Christmas 2025”
- ZeroHedge, “US Beef Cow Cycle Low Set to Deepen, Keeping Steak Prices High”
- Yahoo Finance, “Warsh Call for Fed-Treasury Accord Stirs Debate in $30 Trillion Bond Market”
- Voronoi, “Gold Has Overtaken the US Dollar in Central Bank Reserves”
- MSN, “China Urges Banks to Curb U.S. Treasury Exposure”