
“Doom without a plan is just entertainment for pessimists.”
~ The Dollar Collapse Playbook
—
Written by Bryan Lutz, Editor at Dollarcollapse.com:
Silver touched $118 in late January.
Today it trades near $58, cut in half while gold only slid from $5,088 to $4,027…
Now everyone who chased the spike is licking their wounds, and if you missed it, the story probably looks finished from where you’re sitting.
Here’s why it isn’t.
The January melt-up dragged the gold-to-silver ratio down to 46. The washout since has pushed it back to 69: one ounce of gold once again buys 69 ounces of silver. A year ago the number was 88.
For most of monetary history, when both metals circulated as money, the ratio sat near 16:1.
Here’s the full picture since 1968.
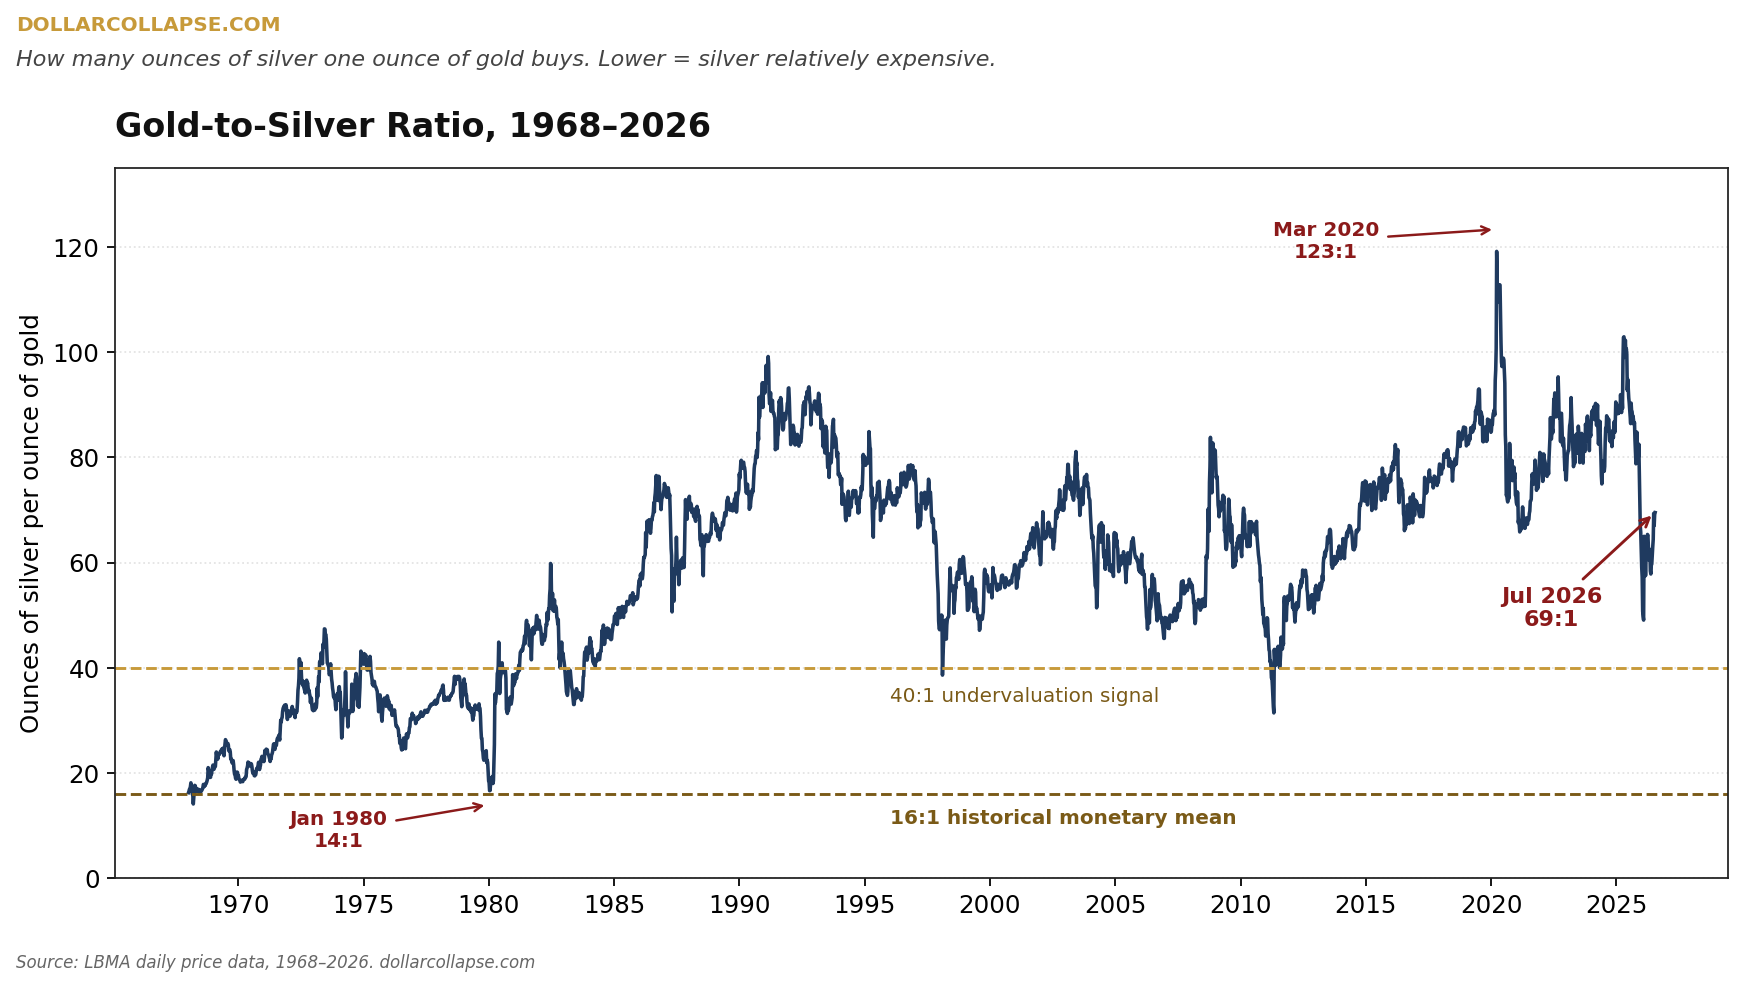
Every extreme reading in that chart snapped back toward the gold lines, and the snap-backs were fast, violent, and unkind to anyone who waited for a better entry.
So what pulls the ratio down again?
Supply. Or rather, the lack of it.
The Silver Institute reports:
Global Silver Investment to Remain Strong in 2026 Against the Backdrop of a Sixth Consecutive Annual Market Deficit
“The silver market is expected to remain in deficit (total supply less demand) for a sixth consecutive year in 2026… at a noteworthy 67 Moz.”
For six straight years the world has used more silver than it digs up.
And unlike gold, most of the silver ever mined is gone. It went into solar panels, electronics, and medical equipment, and nobody gets it back.
Now, the maths. Hold gold at its July 15 price of $4,027 and slide the ratio down the scale:
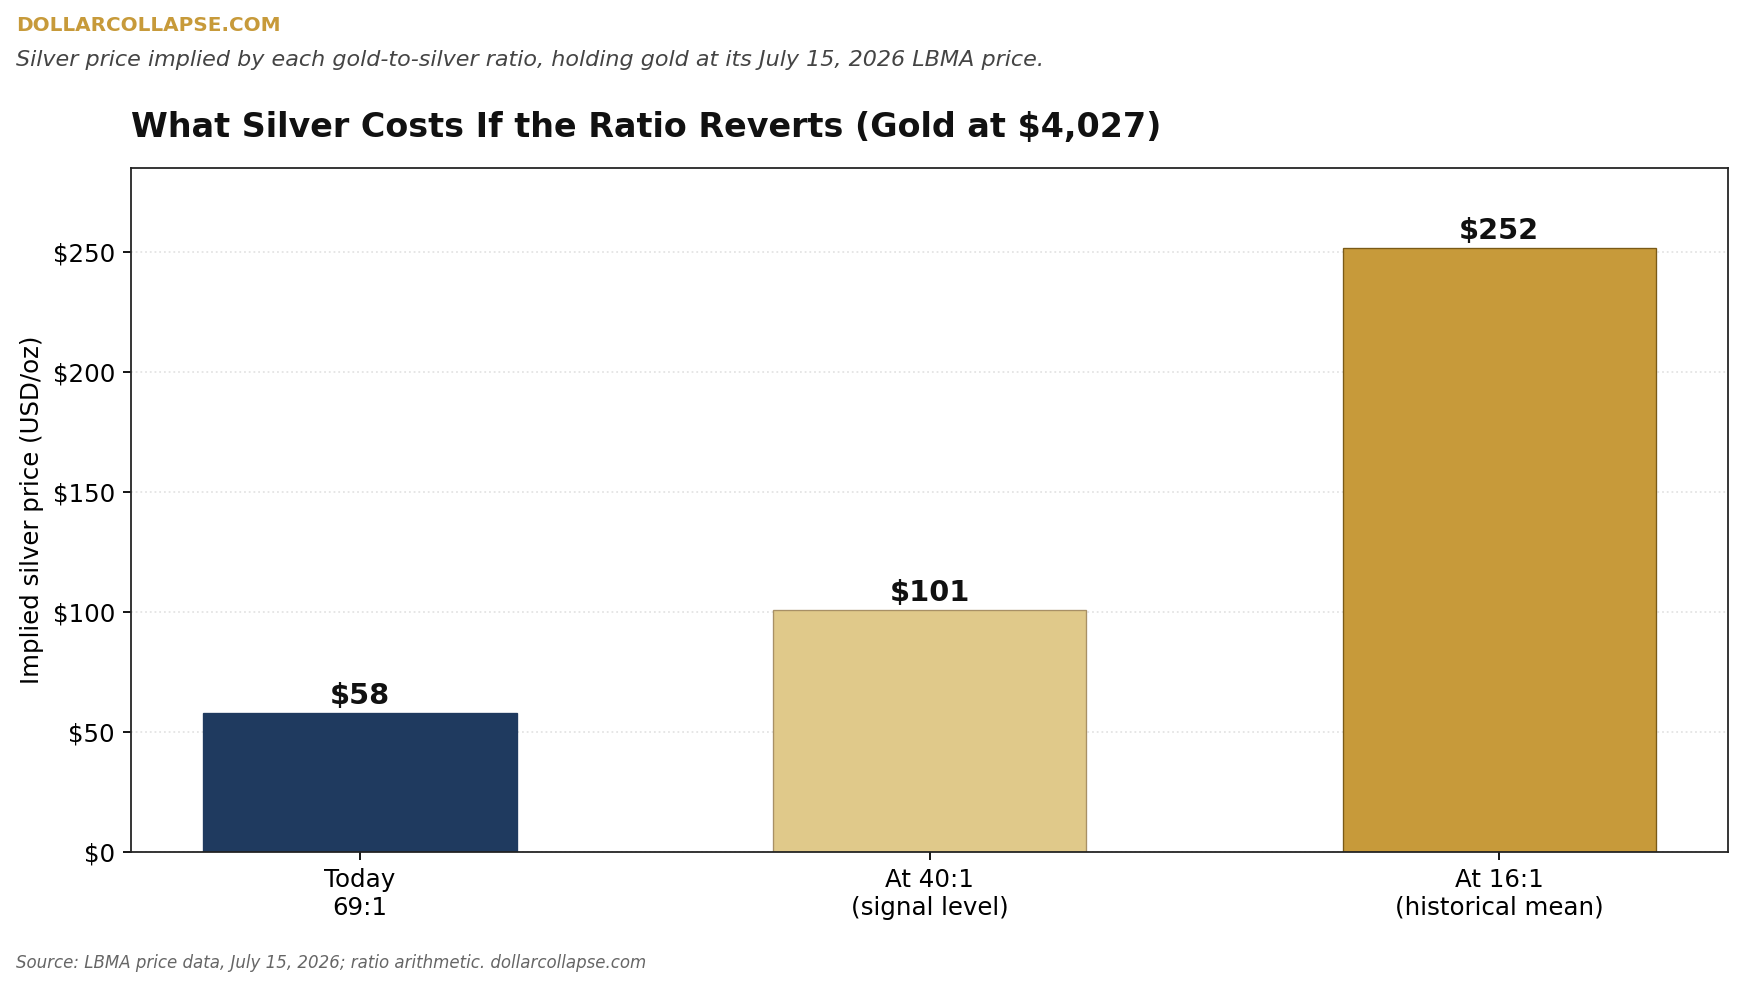
At 40:1, the level that marked silver’s undervaluation extremes in 1998 and 2011, you get $101. At the old 16:1 monetary mean, you get $252.
That second number is where the headline comes from… call it roughly, $250.
What’s an average joe like you and I supposed to do with that?
The coming Dollarcollapse Playbook’s answer is Move 9: physical silver, 3 to 8% of liquid net worth, sovereign coins and bars, accumulated over 6 to 12 months rather than in one buy. Skip the ETFs. And plan your storage, because $100,000 of silver can weigh about 70 pounds.
Now for a warning…
The ratio is not a timing tool. It stayed above its mean for decades, and January proved it can whipsaw in both directions, which is one more data point for you to make your decisions, not a tipping point.
The last time the ratio blew out to an extreme was in March 2020. That’s when silver ran from $12 to $28 in five months.