
Guest post by Willian J. Luther from the American Institute for Economic Research:
The Federal Open Market Committee (FOMC) has revised up its projection for inflation. In the latest Summary of Economic Projections, the median FOMC member projects 3.1 percent inflation in 2023, up from 2.8 percent in September. The median projection for 2024 and 2025 is higher as well: whereas the median FOMC member had previously projected 2.3 and 2.0 percent inflation, it now projects 2.5 and 2.1 percent inflation.
Upward revisions to the inflation projection have become the norm. The FOMC has revised up its projection for inflation every quarter since June 2020.
Inflation Update
Inflation has slowed in recent months, but remains high. Personal Consumption Expenditures Price Index (PCEPI) grew at a continuously compounding annual rate of 5.4 percent from November 2021 to November 2022, down from 5.9 percent for the year ending October 2022. The PCEPI has grown at a continuously compounding annual rate of 4.1 percent since January 2020. As a consequence, prices today are 6.6 percentage points higher than they would have been if inflation had averaged just 2.0 percent over the period.
Core inflation (which excludes volatile food and energy prices and is generally thought to be a more reliable predictor of future inflation) also remains high. Core PCEPI grew at a continuously compounding annual rate of 4.5 percent from November 2021 to November 2022, down from 4.9 percent for the year ending October 2022. It has grown at a continuously compounding annual rate of 3.6 percent since January 2020.
Figure 1. Personal Consumption Expenditures Price Index, January 2020 – November 2022
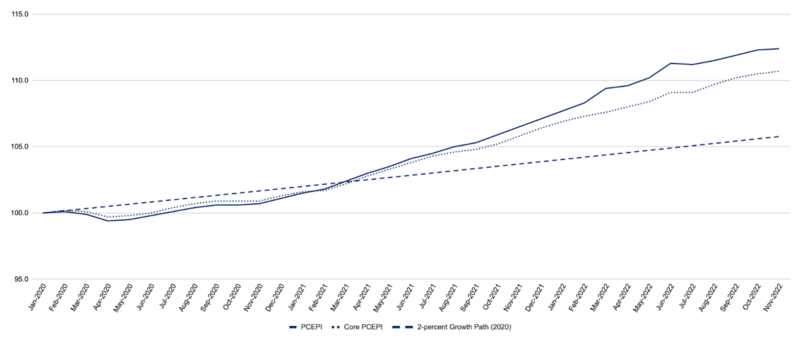
Fortunately, core inflation has declined considerably in recent months. From October 2022 to November 2022, core PCEPI grew at a continuously compounding annual rate of just 2.2 percent. It grew at an annualized rate of 6.6 percent from July to August; 5.5 percent from August to September; and 3.3 percent from September to October.
FOMC Projections of Inflation
Each quarter, FOMC members are asked to project inflation under the assumption that monetary policy is conducted appropriately. Since members also determine how monetary policy is conducted, these projections offer some guidance as to how quickly inflation will fall, that is, if FOMC members do what they say they should do and there are no unexpected shocks to the economy. The median, central tendency, and range of FOMC member projections are reproduced in the tables below.
Table 1. Median FOMC Member Projection of Inflation
| Projection Date | 2022 | 2023 | 2024 | 2025 | Longer run |
| June 2020 | 1.7 | 2.0 | |||
| September 2020 | 1.8 | 2.0 | 2.0 | ||
| December 2020 | 1.9 | 2.0 | 2.0 | ||
| March 2021 | 2.0 | 2.1 | 2.0 | ||
| June 2021 | 2.1 | 2.2 | 2.0 | ||
| September 2021 | 2.2 | 2.2 | 2.1 | 2.0 | |
| December 2021 | 2.6 | 2.3 | 2.1 | 2.0 | |
| March 2022 | 4.3 | 2.7 | 2.3 | 2.0 | |
| June 2022 | 5.2 | 2.6 | 2.2 | 2 | |
| September 2022 | 5.4 | 2.8 | 2.3 | 2.0 | 2.0 |
| December 2022 | 5.6 | 3.1 | 2.5 | 2.1 | 2.0 |
Table 2. Central Tendency of FOMC Member Projections of Inflation
| Projection Date | 2022 | 2023 | 2024 | 2025 | Longer run |
| June 2020 | 1.6-1.8 | 2.0 | |||
| September 2020 | 1.7-1.9 | 1.9-20 | 2.0 | ||
| December 2020 | 1.8-2.0 | 1.9-2.1 | 2.0 | ||
| March 2021 | 1.8-2.1 | 2.0-2.2 | 2.0 | ||
| June 2021 | 1.9-2.3 | 2.0-2.2 | 2.0 | ||
| September 2021 | 2.0-2.5 | 2.0-2.3 | 2.0-2.2 | 2.0 | |
| December 2021 | 2.2-3.0 | 2.1-2.5 | 2.0-2.2 | 2.0 | |
| March 2022 | 4.1-4.7 | 2.3-3.0 | 2.1-2.4 | 2.0 | |
| June 2022 | 5.0-5.3 | 2.4-3.0 | 2.0-2.5 | 2.0 | |
| September 2022 | 5.3-5.7 | 2.6-3.5 | 2.1-2.6 | 2.0-2.2 | 2.0 |
| December 2022 | 5.6-5.8 | 2.9-3.5 | 2.3-2.7 | 2.0-2.2 | 2.0 |
Table 3. Range of FOMC Member Projections of Inflation
| Projection Date | 2022 | 2023 | 2024 | 2025 | Longer run |
| June 2020 | 1.4-2.2 | 2.0 | |||
| September 2020 | 1.5-2.2 | 1.7-2.1 | 2.0 | ||
| December 2020 | 1.5-2.2 | 1.7-2.2 | 2.0 | ||
| March 2021 | 1.8-2.3 | 1.9-2.3 | 2.0 | ||
| June 2021 | 1.6-2.5 | 1.9-2.3 | 2.0 | ||
| September 2021 | 1.7-3.0 | 1.9-2.4 | 2.0-2.3 | 2.0 | |
| December 2021 | 2.0–3.2 | 2.0–2.5 | 2.0–2.2 | 2.0 | |
| March 2022 | 3.7-5.5 | 2.0-2.5 | 2.0-2.2 | 2.0 | |
| June 2022 | 4.8-6.2 | 2.3-4.0 | 2.0-3.0 | 2.0 | |
| September 2022 | 5.0-6.2 | 2.4-4.1 | 2.0-2.5 | 2.0-2.5 | 2.0 |
| December 2022 | 5.5-5.9 | 2.6-4.1 | 2.2-3.5 | 2.0-3.0 | 2.0 |
The median FOMC members’ inflation projection for 2023 increased by 30 basis points between September and December. Projections now range from 2.6 to 4.1 percent, with a central tendency of 2.9 to 3.5 percent. Back in June, FOMC member projections ranged from 2.3 to 4.0 percent, with a central tendency of 2.4 to 3.0 percent.
Forecasting Prices from FOMC Member Projections
Each month, Morgan Timmann and I forecast prices under the assumptions that (1) FOMC members set monetary policy consistent with their projections, (2) inflation is constant from month to month across each year, and (3) there are no unforeseen shocks to the economy over the forecast period. Forecasts from projections made since December 2020 are presented alongside the actual PCEPI series in Figure 2.
Figure 2. Forecast of Price Level from FOMC Member Projections
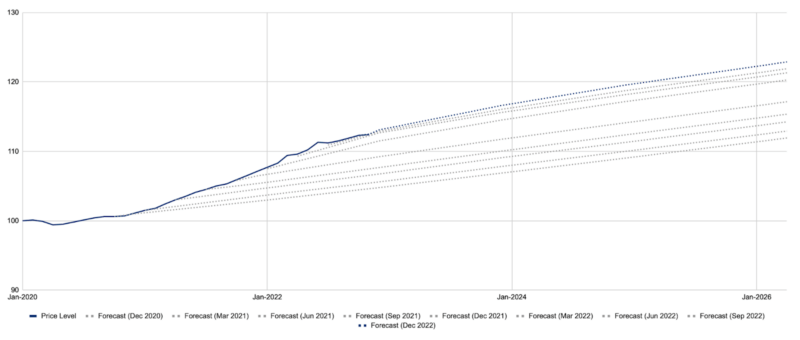
Our forecast indicates that prices will be roughly 16.8 percent higher in January 2024 than they were in January 2020, just prior to the pandemic. In January 2025, they will be 19.7 percent higher. Last December, the forecast suggested prices would be just 14.3 percent higher in January 2025 than they were in January 2020.
Conclusion
If recent monthly core inflation rates are a good guide, inflation appears to have peaked. But FOMC member projections suggest that inflation will come down only gradually over the next two to three years and that the price level will remain permanently elevated. Let’s hope Fed officials will not need to revise up their projections for inflation again in March.
Guest post by Willian J. Luther from the American Institute for Economic Research.
Do you know which numbers really enhance your trades?
You might be surprised to learn that they aren’t on an earnings report or a quarterly statement… Instead, they’re living in the stock prices themselves! I’m Tom Busby, founder of the Diversified Trading Institute and with my “Little Black Book”, you can learn how to harness the power of these key numbers today and enjoy a stronger trading account tomorrow!