Originally posted at Goldmoney.com:
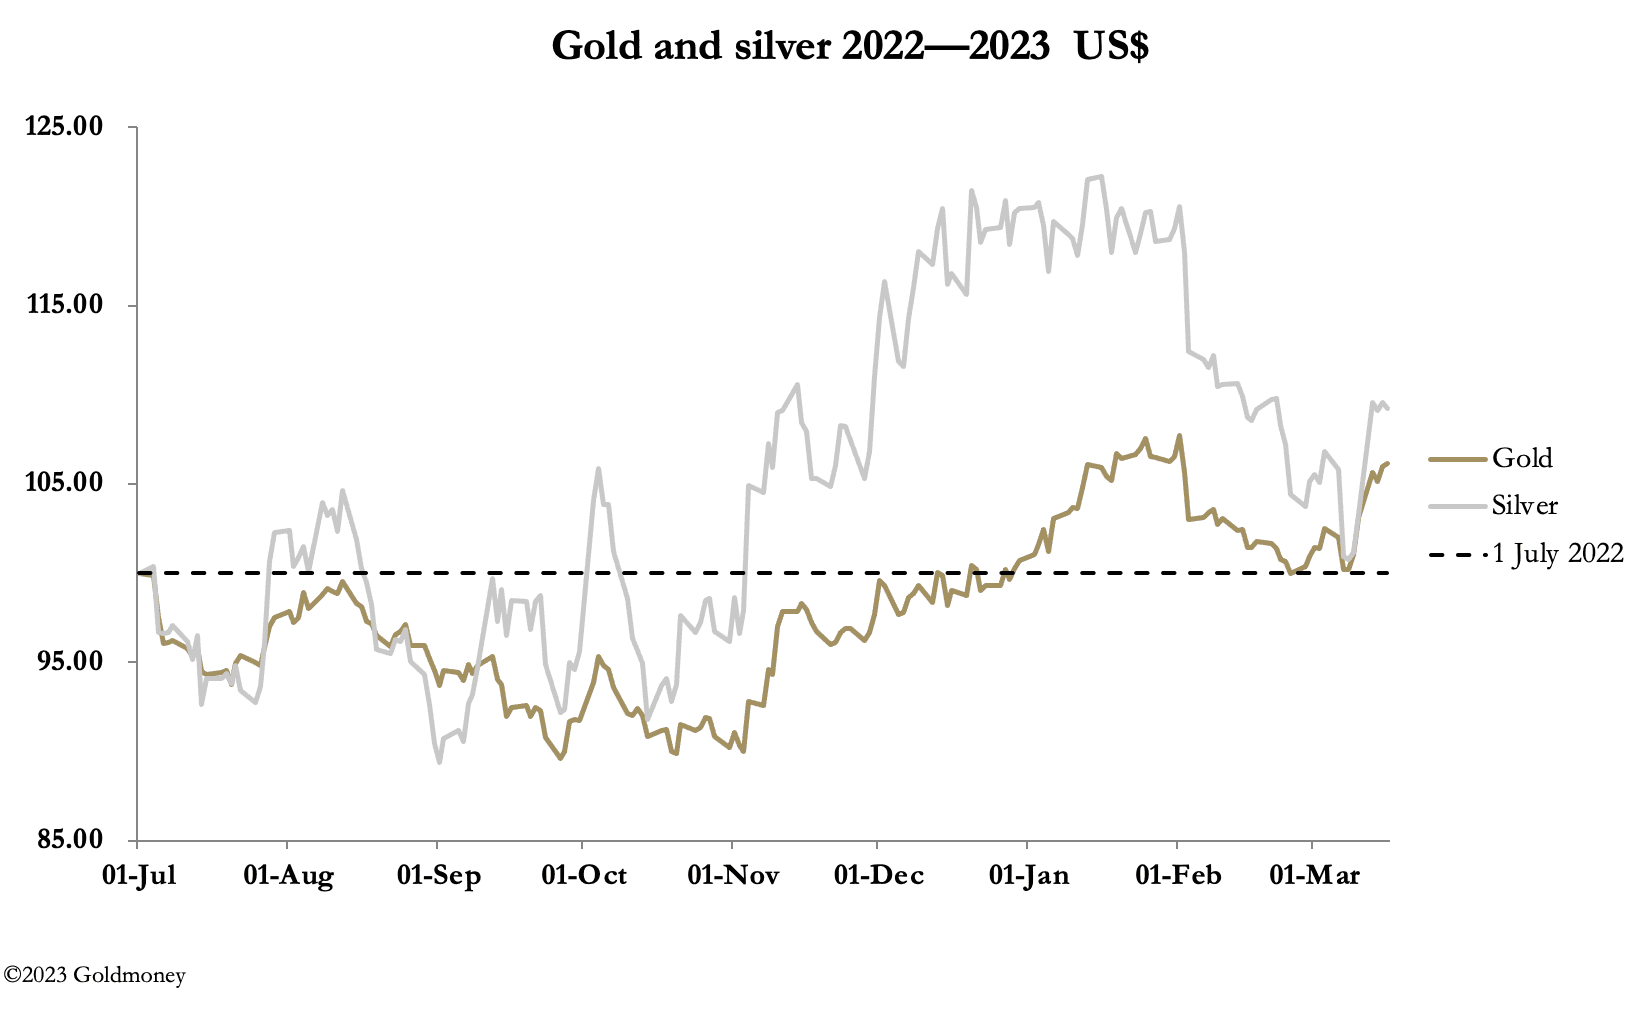
Last weekend saw the failure of three banks in the US: Silver Valley, Signature, and Silvergate. Gold rallied to $1931 in European trade this morning, up $68 from last Friday’s close and up $118 in just seven trading sessions. Silver was $21.86, up $1.35 this week, and $1.85 from the previous Wednesday.
There was a significant element of bear squeeze involved. On Comex, there were days when the gold price rallied, and Open Interest fell indicating that on balance more bears were closing than new bull positions being taken out. Understandably, on Monday trading volumes in both contracts spiked higher after a calamitous weekend. But the subsequent decline in silver volumes took them back to pre-panic levels. And most notably, Open Interest has declined to the lowest levels for many years (the second chart below).

The reason for the change in sentiment is a dawning realisation that the global banking system is in a perilous state. The SVB collapse was brought about by the realisation of hidden losses on its bond portfolio. Worryingly, SVB was investing in long maturity Treasury and Agency debt, something which banks never did in the past.
So why did SVB do this, and is this departure from short-term debt into longer maturities common with other banks? We need to look at the recent history of the yield curve.

When the Fed suppressed interest rates to the zero bound, the yield curve was positive. In March 2021, it stood at 1.53%, which meant that a bank could improve its interest margin by buying a 10-year UST over a 2-year UST by that amount. This was before the inflation monster became apparent, and it is a fair bet that the bank’s inhouse economic advice was that inflation was unlikely to be a problem, given official forecasts. But from then on, the 10—2 spread began to decline as the yield on shorter maturities began to anticipate higher short-term rates, with the 2-year UST yielding 0.75% In January 2022. The effective Fed funds rate then began its fastest rise in recent history, making the cost of funding long positions in long maturities greater than their yield.
It is worth repeating, that funding long maturities off a short-term book has always been a no-no in banking. But of the $4.5 trillion USTs and $2.7 trillion Agency debt on the banking system’s books, we now know that a considerable portion of that is likely to be in long maturities. This is why the Fed has introduced a Bank Term Funding Program, offering to buy in all bond debt at par on a one-year loan. According to JPMorgan, up to $2 trillion of bonds might be involved, adding to the Fed’s QE, and similarly is likely to be impossible to reverse.
It is hardly surprising that markets appear to be waking up to the inflationary consequences, particularly if other central banks introduce similar facilities. But above all, for precious metals traders, it has proved to be an expensive lesson.