
Written by Dave Skarica, Editor of the DollarHedge Insider:
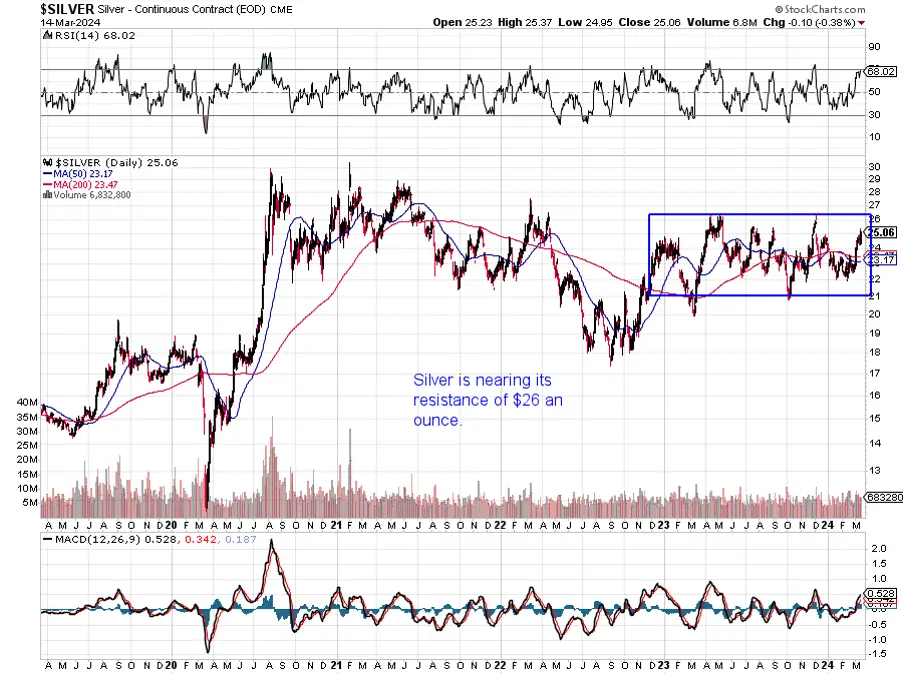
In this week’s stock chart we look at silver. We saw a large jump in Silver this week after it lagged gold during last week’s rally. Silver jumped to nearly $25 an ounce on Thursday March 14th, and is approaching its resistance in the $26 an ounce range which represented resistance in 2023. After this the next resistance is roughly $30 an ounce which was the highs in 2021.
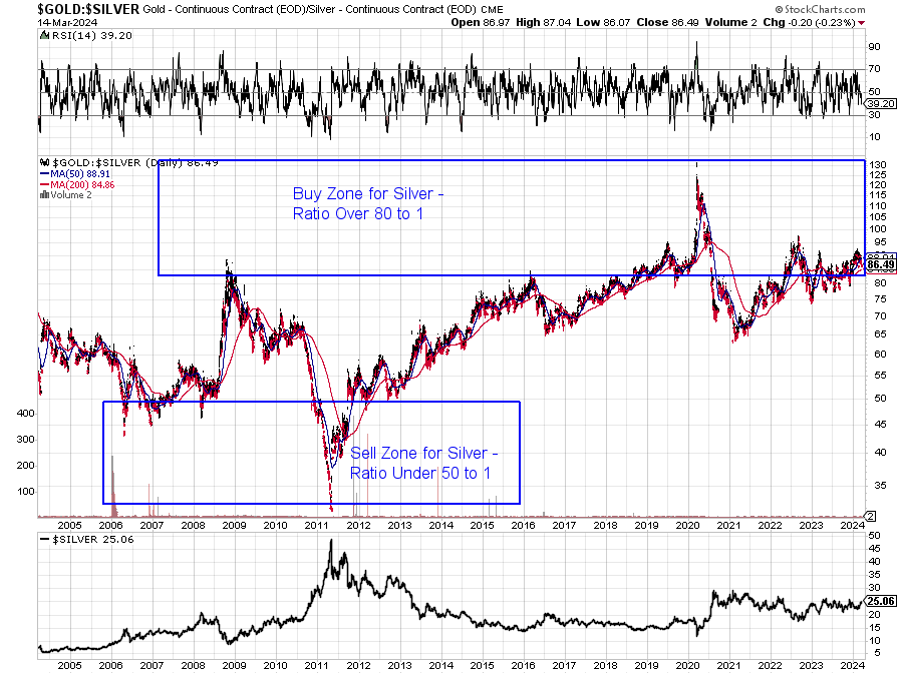
The great news about this rally is Silver is still cheap when compared to gold. There is something called the gold to silver ratio which simply divides gold by the price of silver. It typically trades around 60 to 1 meaning gold trades at roughly 60 times the price of silver. When silver is cheap compared to gold it trades to over 80 to (in 2020 at the Covid lows it reached over 130 to 1!! And Silver promptly doubled in price over the next few months).
Currently Gold is trading at 86 times the price of Silver , telling us Silver is still cheap. When this ratio goes below 50 to 1 , Silver is expensive compared to gold. At the all time high of Silver in 1980 the ratio got all the way down to an all time low of 16 to 1.
Silver is trading higher and nearing resistance but is still cheap. It should be noted that in the gold prodigy we have a few silver stocks on our watch list!