
Written by Bryan Lutz, Editor at Dollarcollapse.com:
Gold miners just posted the best free cash flow numbers they’ve ever posted. Yet, their stock prices pulled back.
This is a great setup for those of us in the precious metals world.
And while the wire churns out daily updates on which semiconductor names price in the 2028 cap-ex cycle, the cheapest sector in the market is printing the most money it has ever printed, and mainstream media isn’t writing about it.
So, let’s talk about what the numbers show.
The senior gold miners pulled in record cash this quarter. Not earnings. Cash. The kind that gets sent back to shareholders as dividends and buybacks, or used to pay down debt, or, occasionally, to swallow a junior down the food chain.
Newmont. Agnico Eagle. Barrick. Wheaton. Franco-Nevada. Kinross. The same names that spent the last decade in the doghouse for blowing capital on bad deposits and worse acquisitions.
Now they’re cash machines.
Newmont alone printed $3.14 billion in free cash flow in Q1 2026. That is the largest quarterly print in the company’s history. Agnico Eagle did $727 million. Kinross did $856 million. Three companies, one quarter, $4.7 billion of cash, with Barrick, Wheaton, and Franco-Nevada still to report.
Step back and the trajectory is sharper. In 2023, those six companies pulled in a combined $1.08 billion of free cash flow for the entire year. In 2024 they did $7.25 billion. In 2025 they did $13.99 billion. Last year alone they out-earned the prior three years combined.
It compounds. Cash on the balance sheet now means more exploration, more buyouts, more buybacks, more dividends.
Here’s the picture in one chart:
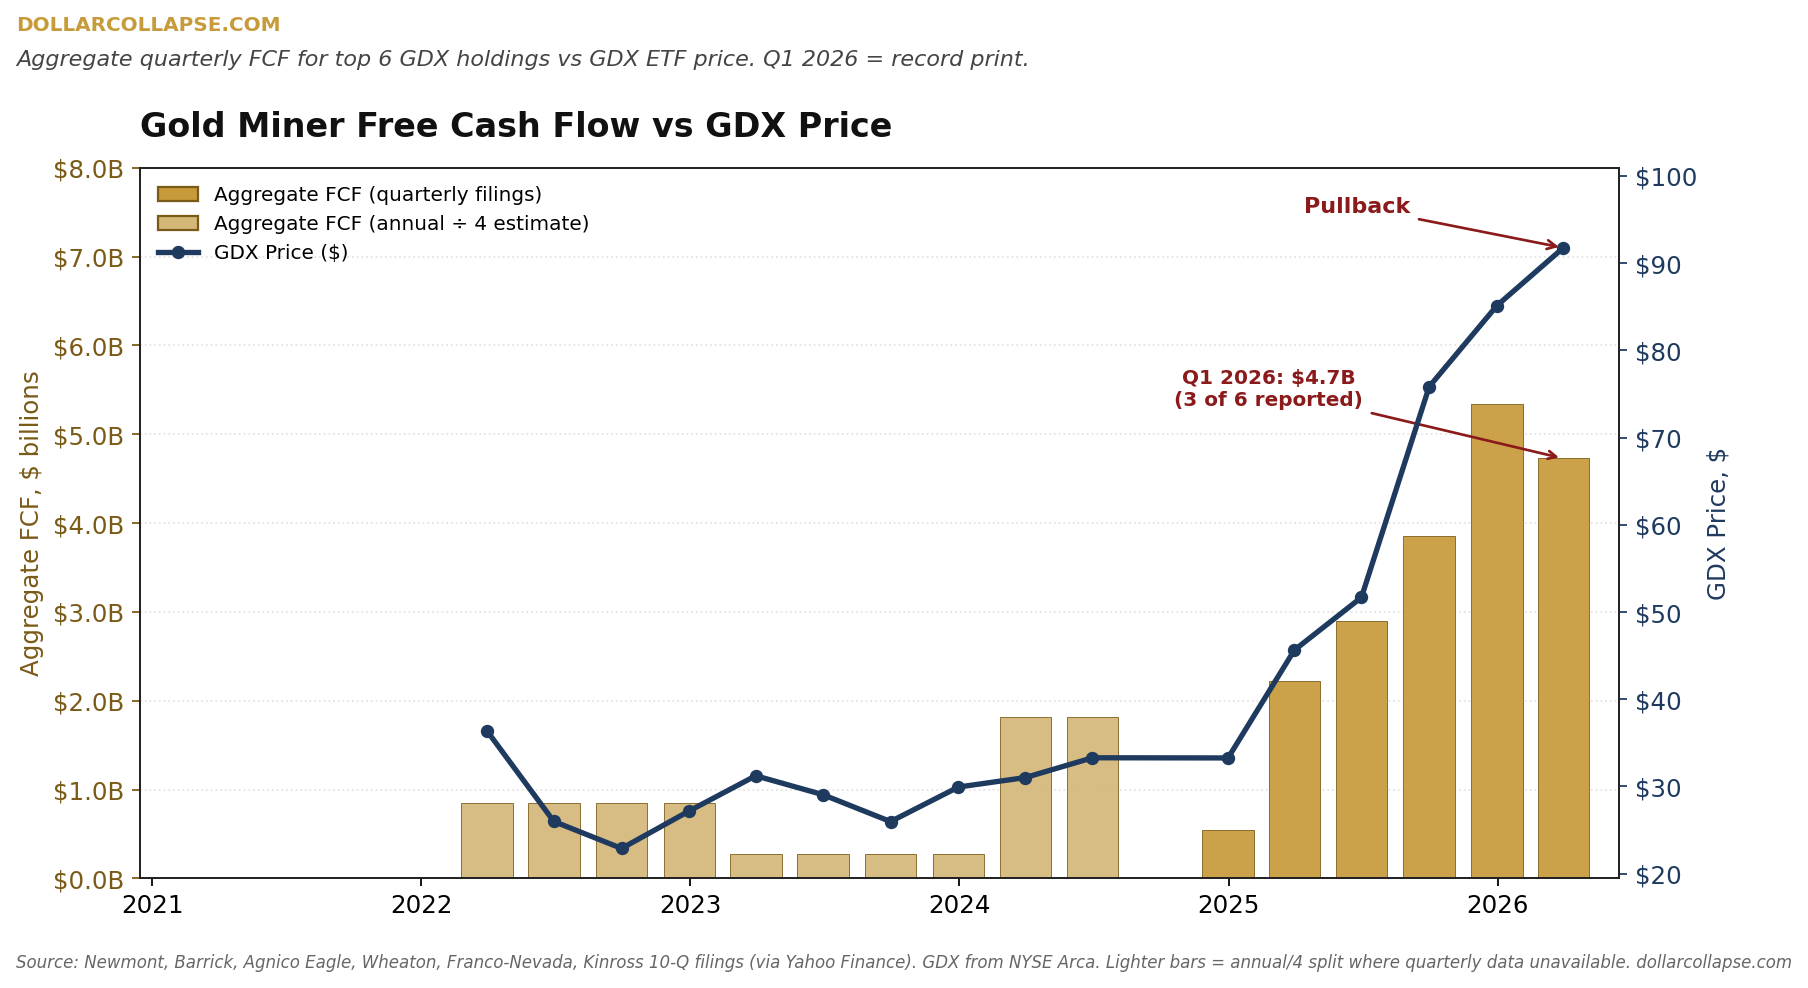
Look at the gap. The bars hit a record in Q4 2025. Q1 2026 will print higher once the remaining three names report. Meanwhile the GDX price just rolled over.
That’s the opportunity.
Now, the price action. Because the pullback is real, and there’s no point pretending it isn’t.
GDX traded as high as $117 in March. It bottomed at $78.74 in late April. That is a 33% drawdown in six weeks, from a sector that had run roughly 250% off its 2024 base.
Miners do that. It’s the leverage, and it works both ways. Right now it’s working down.
GDX closed yesterday at $97.14. Sitting back on a level that, four weeks ago, looked like a ceiling.
Here’s the second chart, and the one that matters more than any single-quarter data point:
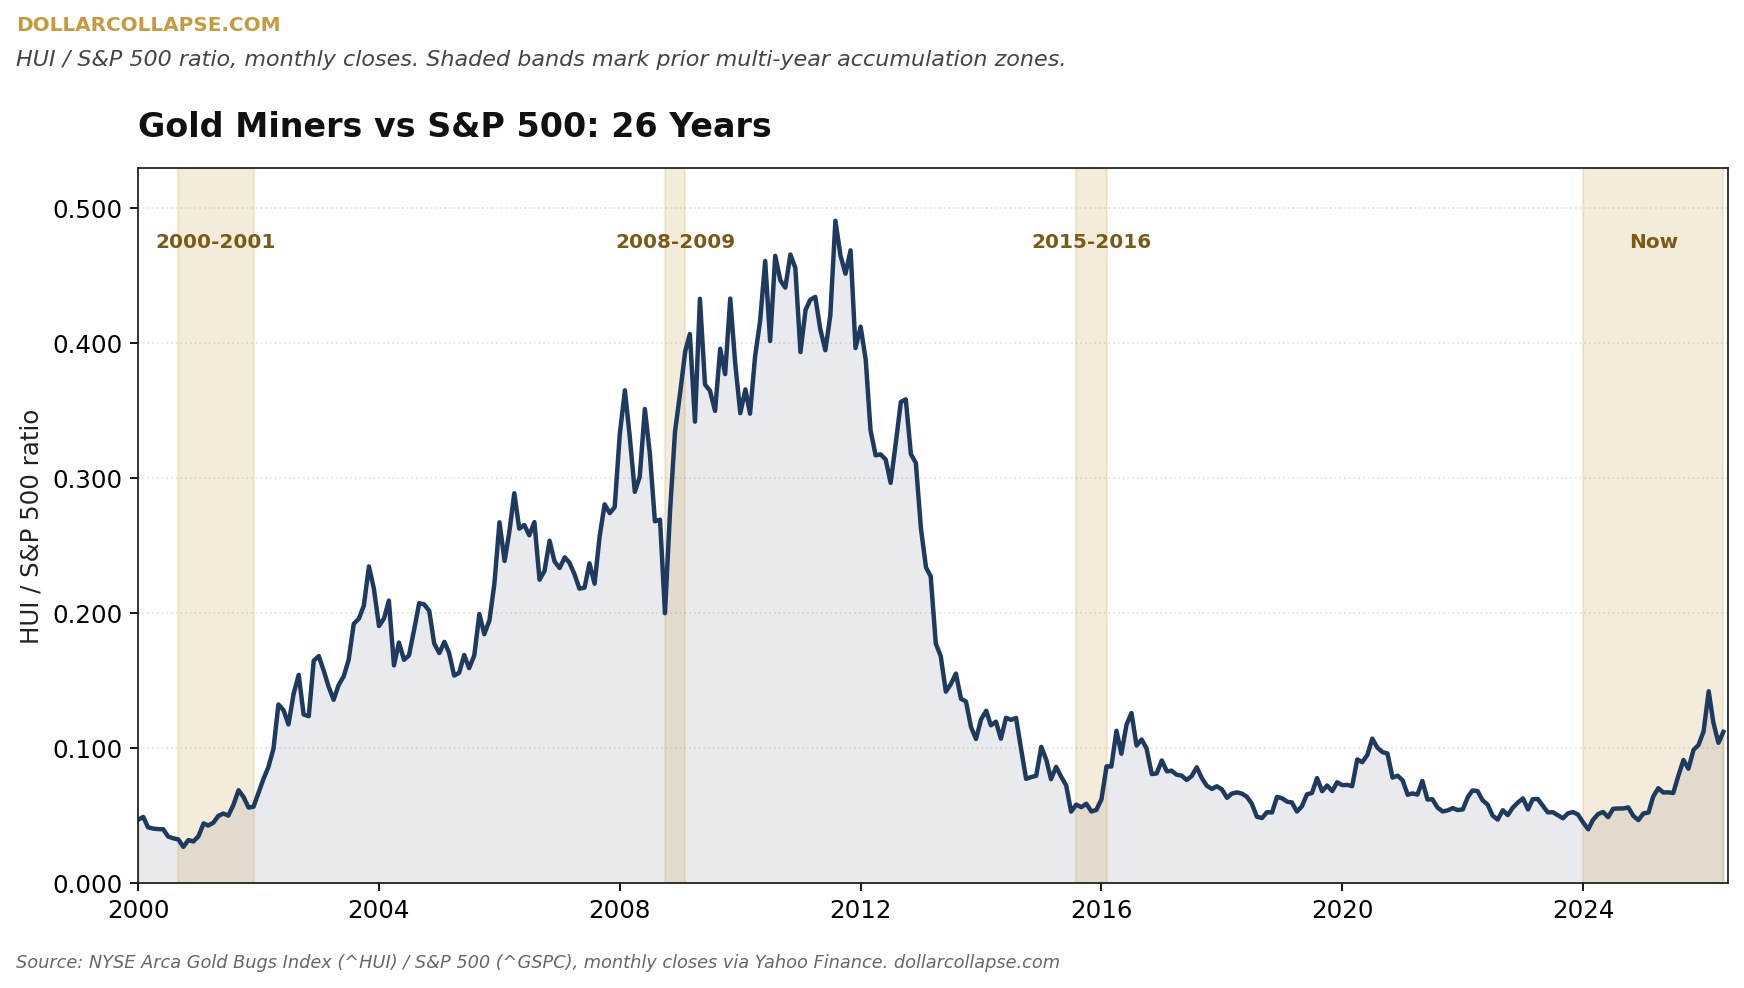
Above is the gold miners versus the S&P 500. Twenty-six years of monthly closes. The shaded bands mark the prior multi-year accumulation zones. In…
2000-2001.
2008-2009.
2015-2016.
Now look at the right side of the chart.
From 2015 through 2024, the ratio chopped along between 0.05 and 0.08, a decade of nothing. In mid-2024 it broke out. By March 2026 it touched 0.14. That’s a near-tripling of the relative performance line in eighteen months, and almost no one in the financial press has labeled it for what it is.
What we’re looking at isn’t the bottom of a base. The bottom was over a year ago, around 2024. This is the first major pullback after a confirmed breakout, with the underlying companies producing more cash than they ever have.
Pullbacks after breakouts are the highest-probability entry the cycle offers. And that means, the base is already in, the trend is established, and any buyer at this level is buying the test of the trend (in my opinion).
The broad market hasn’t priced miners’ earnings yet.
The financial press has been busy this quarter. They’ve been focused on the big AI trend. Big Tech ratcheted past $700 billion in AI capital spending for 2026. One private AI lab is in talks at a trillion-dollar valuation. Chip names are trading at multiples that (by the main stream media’s own admission) are pricing in 2028 earnings. Yet, there are debt deals coming out of these companies that look like sovereign issuance.
All that to say that a lot of money is going into things that print press releases, and almost no money is going into things that print cash.
So, here’s the part that matters.
You don’t have to short the bubble.
You just have to own its opposite. (Or, you could do both).
The crowd is right in the middle and wrong at the ends.
The charts above tell you we’re just getting started.