Written by Bryan Lutz, Editor at Dollarcollapse.com:
Here’s a streak nobody in the gold business brags about. For 28 years in a row, the cost of mining an ounce of gold has gone up compared with the same quarter a year earlier.
“…the 28th consecutive year-on-year increase in AISC.”
World Gold Council and Metals Focus, August 24, 2026
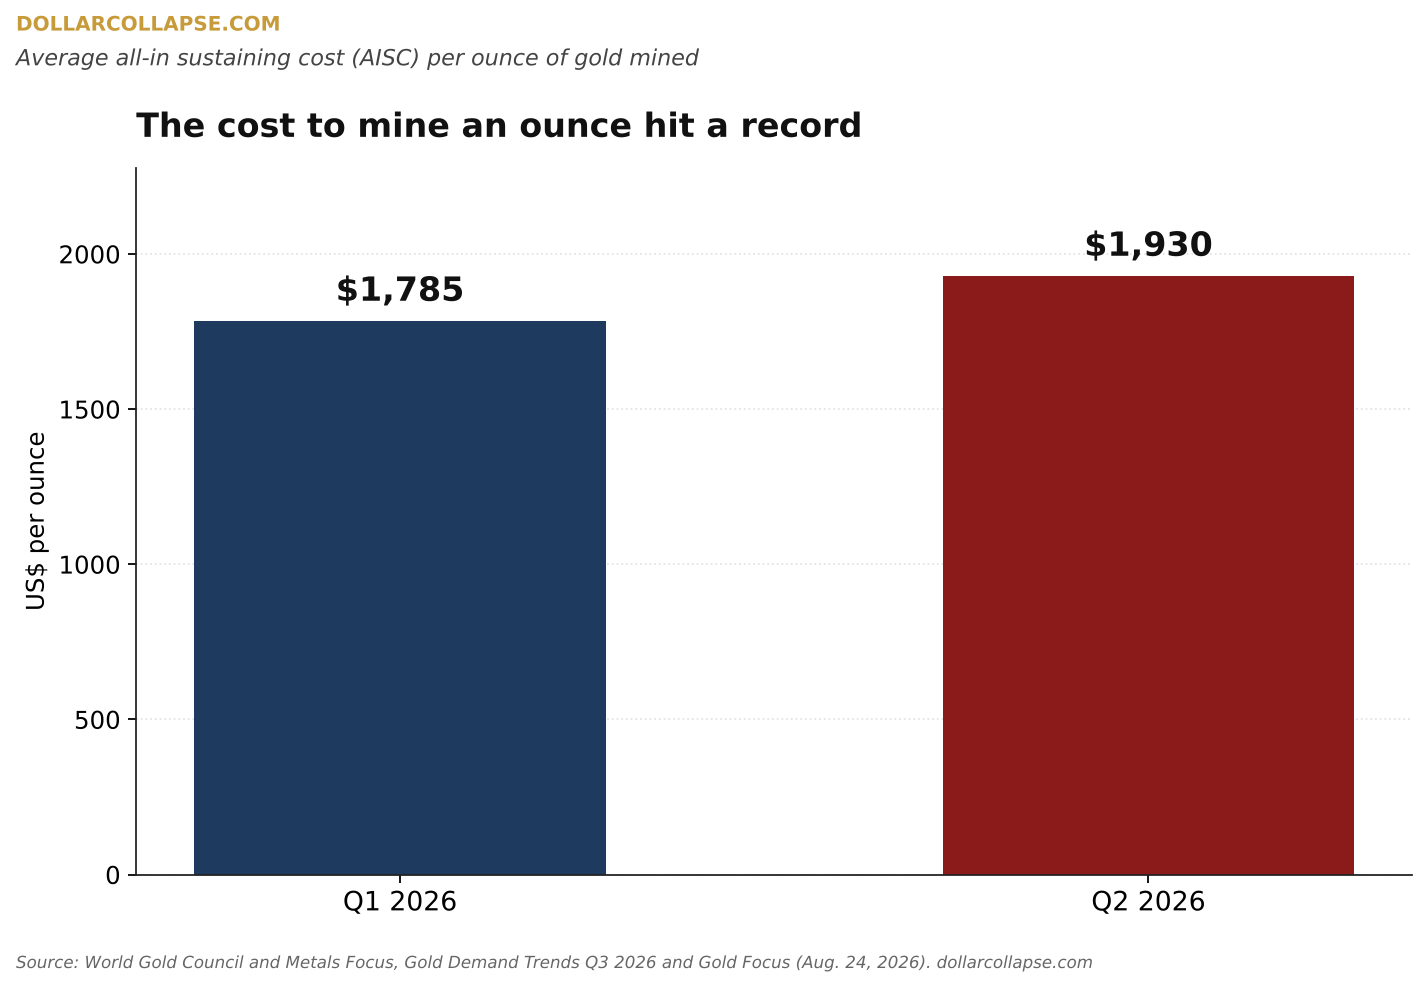
AISC stands for all-in sustaining cost, the industry’s best measure of what it takes to keep a mine running and pull an ounce out of the ground. In the first quarter of 2026 it averaged $1,785 an ounce, up 16% from a year earlier. In the second quarter it hit a record $1,930, up 8% in three months and 22% in a year. That’s the fastest annual jump since 2013.
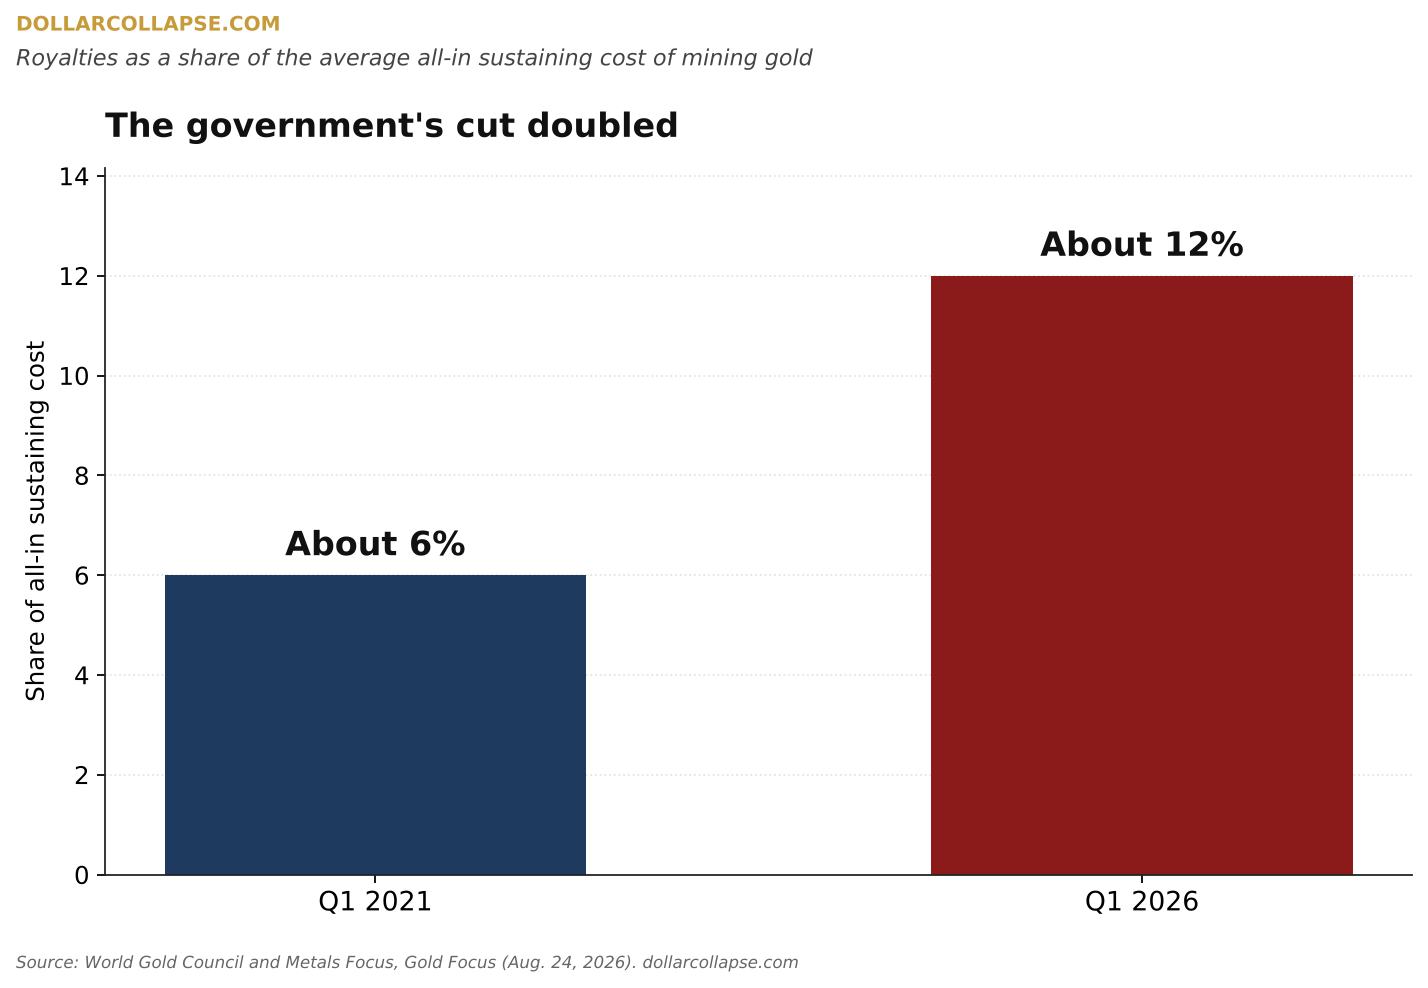
Some of that is the usual list. Diesel, freight, explosives, cyanide and replacement parts all got more expensive. The biggest driver, though, was the government’s cut. Royalty payments made up about 6% of the average miner’s costs in early 2021, and by early 2026 they’d doubled to about 12%. Ghana, for one, brought in a sliding-scale royalty in March 2026 that takes a bigger bite as the gold price climbs.
Now, to be fair, miners made money hand over fist this year. Gold averaged nearly $4,900 in the first quarter of 2026, and the World Gold Council put the average miner’s margin at a record $3,076 an ounce. At those prices, the average mine was a cash machine.
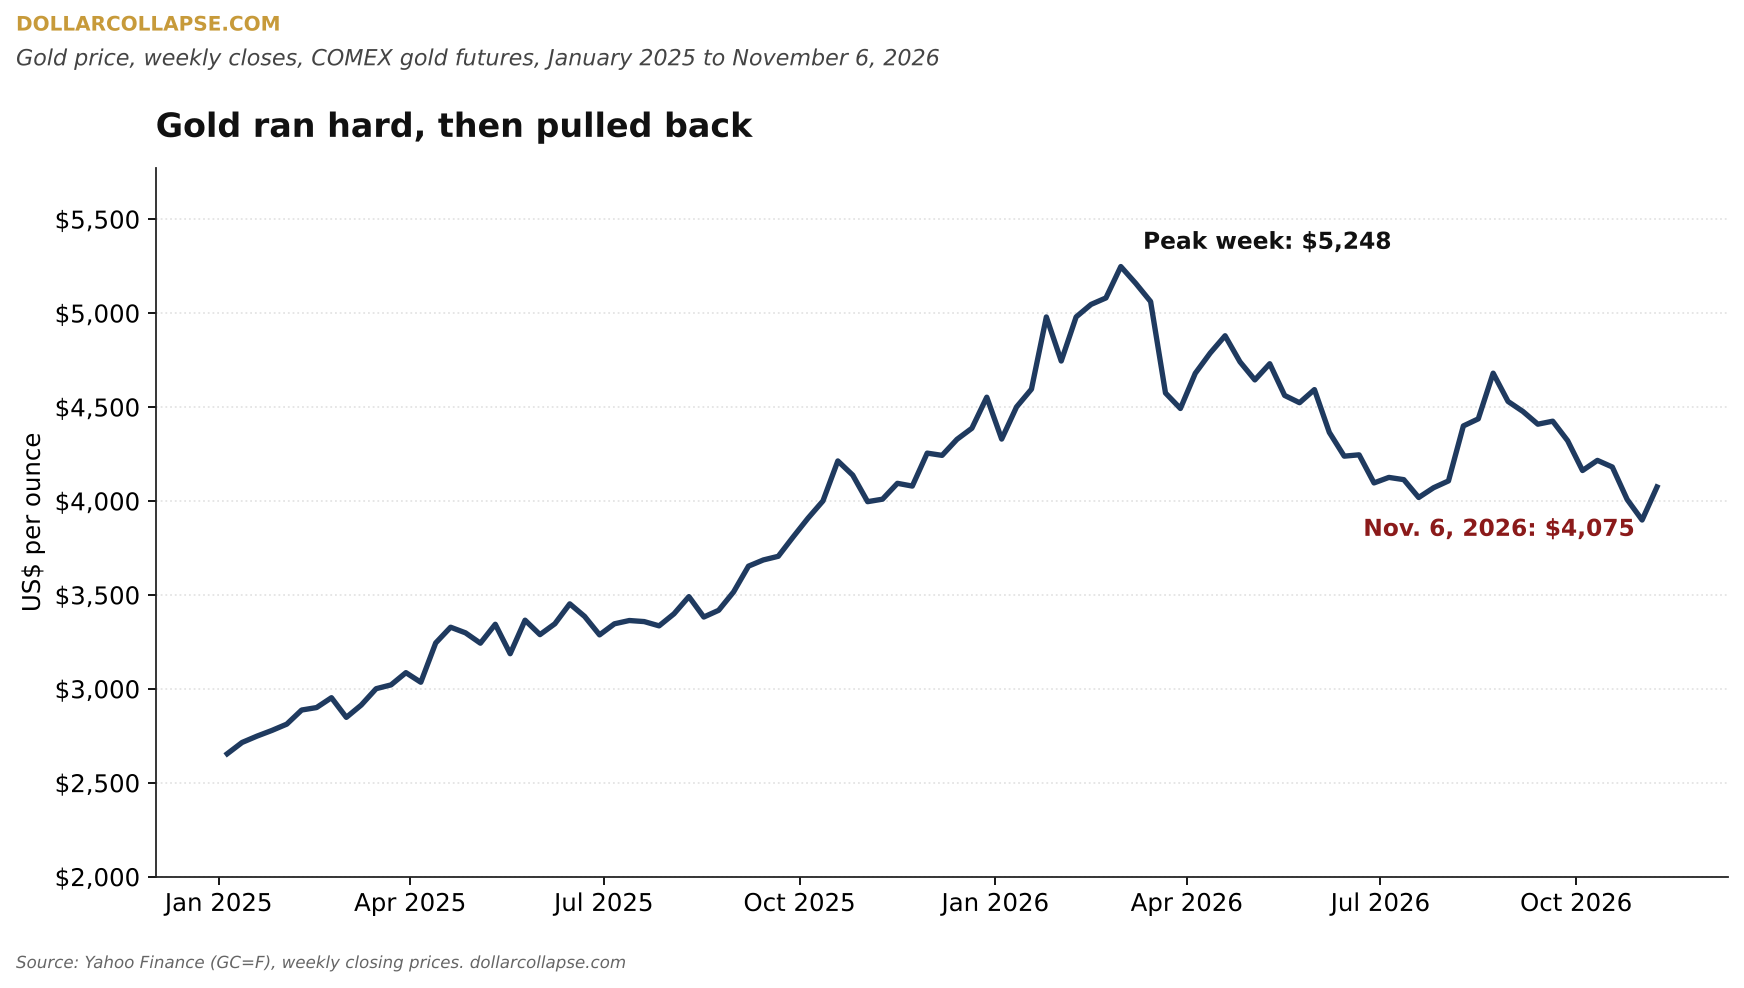
The catch is that costs only move in one direction, and the gold price doesn’t. Gold futures closed at $5,318 on January 29 and finished at $4,075 on November 6, down about 23%.
The Numbers
At $4,075 gold and $1,930 in costs, the average miner clears about $2,145 an ounce. That’s still a healthy business, but it’s about 30% less than the record margin from early this year, and that’s for the average mine. A high-cost producer, or one in a country that just raised its royalty, feels the drop first and feels it harder.
That’s how you can be right about gold and still lose money on a gold miner. The metal can hold most of its gains while a company with rising costs and a bigger tax bill watches its profit shrink.
So when I look at a miner, the first question isn’t how much gold it has. It’s what it costs to get that gold out, and how much the government takes along the way.
Next time, I’ll argue with my own thesis, because there’s way more gold out there than the doom crowd admits.
Sources: World Gold Council and Metals Focus, “Record gold prices outpace rising mining costs in Q1’26,” Gold Focus, August 24, 2026; World Gold Council, Gold Demand Trends Q3 2026; Miningmx, November 3, 2026; Yahoo Finance, COMEX gold futures (GC=F). The margin at $4,075 gold is our own estimate: the November 6 futures close minus the Q2 2026 average AISC.