
Guest post from Paul Wong at Sprott Inc.:
Key Takeaways
- Transition materials markets corrected in February along with other risk assets, but the secular story in energy transition remains strong and the bullish headlines continue.
- Volatility in the macroeconomic environment — especially global interest rate policy — is dominating price behavior, undermining the importance of long-term fundamentals.
- Key materials were impacted by a fall in electric vehicle (EV) sales as China and Europe cut subsidies, but the long-term outlook remains strong despite these exogenous shocks.
- As the arms race in the global energy transition heats up, the drive to secure supply has become more important than price.
- All signs indicate the 40-year bond bull market has ended and the next great secular bull market in commodities has begun.
February in Review
The Nasdaq Sprott Energy Transition Materials Index fell 9.49% in February, giving back two-thirds of its year-to-date gains. The Index fell alongside virtually all risk assets as investors reversed earlier expectations that the U.S. Federal Reserve was close to ending its interest rate hikes.
Equity markets began the month on an upward trajectory on “forced-in buying”16 driven by option call volume, which was at an all-time high. Optimism about a soft landing for the U.S. economy began to give way to a “no-landing” scenario — that is, no slowing in the economy at all. The U.S. Federal Reserve (“Fed”) offered little pushback to easing financial conditions. By early February, markets were pricing in an “immaculate disinflation” scenario — a soft landing with declining inflation and no labor market pain.
Later in February, risk markets were affected by a series of data releases (e.g., January nonfarm payrolls, retail sales, the Institute for Supply Management services report17 and the producer price index) that pointed to a stronger-than-expected U.S. consumer seemingly immune to Fed rate hikes.
Less than three months ago, the consensus expectation was that the U.S. economy would enter a recession in the first half of 2023, leading to a Fed pause, followed by rate cuts in the second half of 2023. These hopes have been dashed, and the timing of possible rate cuts has been pushed out to early 2024. The market now expects a terminal Fed funds rate of 5.42%, 50 basis points higher than a month previously. This is a surprising change in expectations. It is also important to note that these expectations may change again in the near term given the recent stresses in the U.S. banking system.
The 2 YR U.S. Treasury yield reached a new high of 5.05% on March 8, and the U.S. dollar has staged a sharp rally back to resistance levels.18 Macroeconomic volatility remains high.
Figure 1. Energy Transition Materials Consolidate Gains (2018-2023)

Source: Bloomberg. Data as of 3/6/2023. The relative strength index (RSI) is a momentum indicator that measures the speed and magnitude of a security’s recent price changes to evaluate overvalued or undervalued conditions in the price of that security. Included for illustrative purposes only. Past performance is no guarantee of future results. You cannot invest directly in an index.
For Critical Materials, Supply Takes Precedence Over Price
The COVID pandemic exposed the fragile state of the EV industry’s supply chain, and the Russia-Ukraine war further disrupted metal markets. Over the past several months, major corporations and government agencies have made headlines with significant investments in key mineral suppliers to secure or hedge supply. While this activity is bullish for critical minerals and commodities, it also indicates that supply is becoming more important than price for corporate and government players.
As LG Chem — the parent company of the world’s second-largest producer of EV batteries — noted in a frank and insightful interview with Bloomberg Television, their “first and foremost priority is to secure enough raw material for the future.”19
U.S. government agencies such as the Department of Defense and Department of Energy have also announced direct funding in mining projects to secure critical minerals. This de facto national industrial strategy acknowledges the sheer amount of critical minerals and immense upfront capital requirements. The U.S. government is stepping up its investment in disrupting global supply chains to bring EV component industries back to the U.S. and essentially reshore a significant element of its national security.20
Some recent headlines illustrate the race to secure supplies of critical energy transition materials:
- GM to Invest $650 Million in a Lithium Company to Support its Electric Vehicle Business
- DOE Grants $375M Loan for Lithium Battery Recycling Plant
- First Contracts Awarded for U.S. Strategic Uranium Reserve
Energy Transition Sparks a New Arms Race
The rush to secure critical minerals is analogous to the Cold War arms race, as nations compete to acquire and control vital resources essential to national security and economic competitiveness.
During the Cold War, the U.S. and the Soviet Union engaged in an arms race to develop nuclear weapons and other technologies essential to maintaining military superiority and deterring potential adversaries. This competition drove significant investments in conducting research and development (R&D), stockpiling materials and developing supply chains to support military production.
Today, nations are competing to acquire and control access to critical materials for clean energy and electric vehicles—materials that are vital to economic competitiveness and national security. Government efforts have produced policies and programs designed to secure critical mineral supplies and initiatives to promote domestic production (onshoring) and strengthen international partnerships and alliances (near- or friend-shoring). There is also a growing focus on developing more resilient supply chains for critical minerals to reduce dependence on foreign sources and reduce the risk of supply disruptions.
The U.S. has a long history of securing critical minerals through government action. In 1946, the U.S. established the Defense National Stockpile Center (DNSC) to maintain strategic and critical material stockpiles such as tungsten and titanium during the Cold War. The Defense Production Act of 1950 provided funding and other incentives to private industry to develop and produce strategic materials. The U.S. recognized the importance of these metals for national defense and established programs to secure a reliable supply and manage stockpiles. The Inflation Reduction Act of 2022 provides billions in grants and loans to spur the financing and development of initiatives for the energy transition.
These programs and others are active today in the critical minerals space, focused on funding and developing resources, and securing supply chains. The arms race in energy transition is in its early stages, but it is moving rapidly and often stochastically as geopolitical events evolve.
Below are some high-level observations on the race to secure critical minerals, which we will expand on in future commentaries.
- The race to secure critical minerals is highly inflationary because building entirely new energy infrastructure—from obtaining raw materials to processing and refining them to distributing them via resilient supply chains — is extremely capital intensive.
- A massive amount of upfront capital will be needed before the benefits of the energy transition may be realized. Capital must be sourced and deployed, creating demand-pull on the entire energy transition sector and industrial base.
- Capital availability will likely outpace the capacity to spend. After three decades of offshoring and over a decade of chronic underinvestment in commodity resources, capacity (including commodity supply and stockpiles, skilled trades, equipment, engineering and construction) is starting from a decades-low base relative to the overall economy.
- Commodities (especially critical minerals) are becoming scarcer and therefore more valuable. The market is well past “peak cheap commodities.” We foresee concurrent demand and supply shocks and the emergence of a commodity supercycle.
- Industrial policy is moving toward industrial sovereignty with national security as a focal point. Governments are using policy, legislation, capital investment, grants, loans and other means to “crowd in” private sector investment, de-risking it to create more predictable returns and long-term incentives.
Is the Great Secular Bond Bull Market Over?
From 1981 to 2020, U.S. Treasury yields were in one of the longest and most remarkable secular bull markets in history as interest rates and bond yields continued to decline. During this period, the broader commodities market relative to U.S. Treasuries was in an equally long secular bear market, as commodities continually underperformed bonds.
Figure 2 shows the 40-year downward trend in the U.S. 10-year Treasury yield that ended in 2020, as well as the ratio of the BBG Commodity Index to U.S. Treasuries. This ratio is on the verge of severing its 40-year downtrend and breaking higher.
From an investment point of view, commodities appear poised to outperform bonds for a prolonged period. Measured from the peak in 1981, the r-squared21 between the U.S. 10-year yield and the BBG Commodity Index to US Treasury Index Ratio is 0.83 — i.e., it is highly correlated.
Technically speaking, the chart patterns below show a reversal, complete with a classic climatic blow-off action after a very long secular trend. Our long-term fundamental macro outlook (see our 2023 Top 10 Watch List) points to higher secular inflation and greater macro volatility as a result of deglobalization, the drive for energy security and global competition for commodities.
If this is indeed the end of the 40-year bond bull market, the ramifications for capital markets will be epochal. The immediate question is whether the U.S. Treasury market (the world’s largest and deepest asset pool), which saw two significant liquidity malfunctions in the past three years (2020 and 2022), can handle a substantial outflow of capital. Not only has quantitative easing ended, but quantitative tightening is in full force. Foreign buying of U.S. Treasury bonds peaked a decade ago, and in 2022, foreign U.S. Treasury holdings fell sharply. We expect this trend to continue (see our January 2023 Gold commentary). The coming inflationary push from the energy transition and reshoring of the U.S. industrial base will stress bond markets and boost commodity markets.
Figure 2. End of Two 40-Year Cycles? (1972-2023)

Source: Bloomberg. Data as of 3/6/2023. Included for illustrative purposes only. Past performance is no guarantee of future results. You cannot invest directly in an index.
Updates on Critical Materials
Lithium: Price Declines on EV Market Shock
The lithium carbonate spot price continued its fall from the November 2022 peak, declining 23.95% in February. Despite this drop, lithium prices remained higher than their level 12 months ago (see Figure 3), largely due to the exponential growth in EV sales in recent years. (Per BloombergNEF,22 electric vehicles were responsible for 76% of lithium demand in 2022.)
The EV tailwind has reversed for now, however. Global electric vehicle sales fell dramatically in January 2023, according to Rystad Energy (see Figure 4), as demand was pulled forward to December 2022 following cuts to EV subsidies in China and Europe. In January, EV sales in China fell 50% month-over-month and 6% year-over-year, according to the China Association of Automobile Manufacturers (China accounted for 58% of global EV sales in Q4 2022, according to BloombergNEF). These events, along with dampened short-term investor sentiment and news that CATL, a large battery manufacturer, was pressuring lithium suppliers for price concessions, weighed heavily on lithium prices in February.
Despite these challenges, the lithium market landscape exhibits positive features as well. The price of lithium is still significantly higher than its long-term average and above many lithium miners’ cost curves. Lithium demand is forecast to grow exponentially due to the metal’s dominant role in EV lithium-ion batteries. Large OEMs are well aware of this, and some have taken strategic stakes in lithium producers. For example, General Motors invested $650 million in Lithium Americas in January 2023, and Stellantis invested €50 million in Vulcan Energy in June 2022. Tesla is also said to be considering the acquisition of Brazilian miner Sigma Lithium.
Figure 3. Lithium Price Holds Above Long-Term Average (2018-2023)

Source: Bloomberg. Data as of 3/15/2023. Included for illustrative purposes only. Past performance is no guarantee of future results.
Figure 4. EV Sales Plummet in January 2023

Source: Rystad Energy, March 2023. Included for illustrative purposes only. Past performance is no guarantee of future results.
Uranium: Contracting at New Highs
In a month where most commodities and equities sold off, the uranium spot price held steady in February with a slight gain of 0.20%. Uranium continues to show exceptional longer-term performance. Market fundamentals, which are the most positive in over a decade in our view, should continue to be the primary driver. The strength in uranium prices in February relative to softness in other metals and commodities highlights physical uranium’s low correlation with other major asset classes and its potential portfolio diversification benefits (see Figure 5).
Long-term uranium contracting continued to hit new records in February (see our report “Uranium’s Mixed February” for more details). Cameco, Canada’s leading uranium producer, announced it had entered into an agreement with Energoatom, Ukraine’s state-owned nuclear energy utility, for a supply contract of 40‒67 million pounds of uranium. By comparison, Cameco contracted a total of 80 million pounds in 2022 and 30 million pounds in 2021. A significant amount of supply is already under contract, and more long-term contracts are likely to follow as utilities focus on supply security, representing a major potential tailwind for uranium and uranium miners.
Figure 5. Low Correlations Highlight Uranium’s Diversification Benefits
U3O8 Uranium Spot Price Correlations With Selected Indices (2/28/2003-2/28/2023)

Source: Bloomberg and TradeTech LLC. Data for the uranium spot price is from TradeTech LLC. Other asset classes are from Bloomberg, namely S&P GSCI global commodities index, S&P 500 index, Bloomberg Barclays US Aggregate Bond index, FTSE Nareit Equity REITs index, Golds, LBUTTRRUU Index, and DXY US dollar index. Included for illustrative purposes only. Past performance is no guarantee of future results.
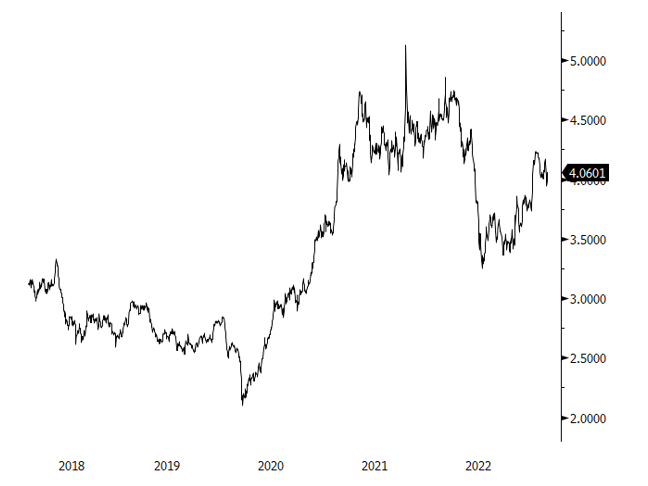
Copper: Global Bellwether for Volatile Markets
Copper continued to perform its role as a bellwether of the global economy in February. The spot price of copper fell 2.7% in February alongside declines in other risk assets amid investor uncertainty about the direction of future Fed rate hikes.
In February, Panama ordered the suspension of a large copper mine over a tax dispute, highlighting how exogenous events can disrupt the copper supply chain. Decreasing major discoveries of copper, low inventories, long lead times and declining ore grades combine to make it difficult to ramp up global copper supply.
At the same time, demand from the global energy transition process is likely to be meaningful as copper is essential in power grids, electric vehicles and clean energy technologies. Many of these technologies use much more copper relative to carbon-intensive alternatives. For example, an electric vehicle contains approximately 53 kg of copper versus 22 kg in a conventional internal combustion engine vehicle, according to the International Energy Agency.23 The acceleration toward low-carbon energy sources over the coming decades will profoundly affect the copper market. To meet net-zero emissions targets, demand for copper may increase by close to 60% from 2022 to 2040, according to BloombergNEF.
Figure 6. Copper Follows Other Risk Assets Down in February (2018-2023)
Source: Bloomberg. Data as of 3/15/2023. Included for illustrative purposes only. Past performance is no guarantee of future results.
Nickel: Fundamentals Remain Strong Despite EV Headwinds
The nickel spot price had a challenging month, falling 18.45% in February along with the general decline in equity, bond and commodity markets (see Figure 7). Demand for nickel is predominantly from stainless steel production, which ties nickel to the ups and downs of the global economy. Nickel is also critical to electric vehicles; in fact, most of its projected growth comes from this sector. The EV market became a headwind for nickel in February given the recent weakness in global EV sales.
In addition to the EV market challenges, negative headlines affected the nickel market in February when a major nickel trading company, Trafigura, announced a $577 million impairment charge after purchasing nickel shipments that ended up lacking the metal. The nickel market last made a high in March 2022 when Russia’s invasion of Ukraine sparked a historic short squeeze, pushing the London Metal Exchange to cancel all trades on March 8, 2022. Since then, the nickel market has become more volatile, but it continues to trade at price levels that haven’t been seen in over a decade.
From a long-term perspective, nickel demand is expected to grow significantly due to its use in NMC (Lithium-Nickel-Manganese-Cobalt-Oxide or LiNiMnCoO2) cathodes for EV lithium-ion batteries. Nickel-intensive cathodes are gaining traction because adding nickel to batteries provides greater energy density and increases EV vehicles’ driving range. As global demand for EVs grows, nickel supply is unlikely to keep up with demand, even as additional supply comes online from Indonesia. A major factor in this supply-demand imbalance is that Russia is a significant nickel producer, including the Class 1 nickel needed for lithium-ion batteries, and is likely to remain under economic sanctions for quite some time.
Figure 7. Nickel Price Decline Masks Core Market Strength (2008-2023)

Source: Bloomberg. Data as of 3/15/2023. Included for illustrative purposes only. Past performance is no guarantee of future results.
Bumps on a Long, Upward Trajectory
While overall market conditions in critical metals remain volatile, the long-term fundamental drivers are strong. Governments and corporations continue to ramp up large-scale investments in critical metals like lithium, uranium, copper and nickel, with the goal of onshoring the primary components of energy transition infrastructure and securing a resilient and sustainable supply chain. This considerable task — the reversal of the movement over the past three decades to increase globalization and offshoring to low-cost producers and supply sources — is in its early stages today. But despite its nascency, this powerful trend will have considerable consequences for commodities, capital markets and inflation.
Critical Materials: February 2023 Performance
| Metric | 2/28/2023 | 1/31/2023 | Change | Mo % Chg | YTD % Chg | Analysis |
| Miners | ||||||
| Nasdaq Sprott Energy Transition Materials™ Index1 | 993.26 | 1,097.37 | (104.11) | (9.49)% | 6.36% | Pullback to 200 daily moving average & rising trendline |
| Nasdaq Sprott Lithium Miners™2 | 1,035.87 |
1,168.25 | (132.38) | (11.33)% | 12.31% | Pullback to 200 daily moving average & rising trendline |
| North Shore Global Uranium Mining Index3 | 2,563.83 | 2,782.73 | (218.90) | (7.87)% | 5.64% | Consolidating along 200 daily moving average |
| Solactive Global Copper Miners Index4 | 138.77 | 150.90 | (12.13) | (8.04)% | 6.50% | Bouncing off short-term support |
| Nasdaq Sprott Nickel Miners™ Index5 | 885.95 | 980.48 | (94.53) | (9.64)% | -2.65% | Trade range since 2022 nickel chaos |
| Nasdaq Sprott Junior Copper Miners™ Index6 | 925.86 | 996.65 | (70.78) | (7.10)% | 7.86% | Pullback from 1,000 resistance |
| Nasdaq Sprott Junior Uranium Miners™ Index7 | 1,038.01 | 1,191.26 | (153.26) | (12.87)% | 1.13% | Consolidating within larger flag pattern |
| Physical Materials | ||||||
| Lithium Carbonate Spot Price $/lb8 | 24.23 | 31.86 | (7.63) | (23.95)% | (29.06)% | Breaking lower, after exponential gains |
| U3O8 Uranium Spot Price $/lb9 | 50.85 | 50.75 | (0.10) | 0.20% | 5.25% | Holding just above $50 |
| LME Copper Spot Price $/lb10 | 4.06 | 4.17 | (0.11) | (2.70)% | 7.01% | Holding above $4 resistance |
| LME Nickel Spot Price $/lb11 | 11.15 | 13.68 | (2.52) | (18.45)% | (17.72)% | Volatility post-LME squeeze continues |
| Benchmarks | ||||||
| S&P 500 TR Index12 | 3,970.15 | 4,076.60 | (106.45) | (2.44)% | 3.68% | Rangebound despite shifting macro |
| DXY US Dollar Index13 | 104.87 | 102.10 | 2.77 | 2.72% | 1.30% | Rally at overbought & resistance |
| BBG Commodity Index14 | 106.16 | 111.80 | (5.64) | (5.05)% | (5.89)% | Breaking lower, exhaustion setup |
| S&P Metals & Mining Select Industry TR Index15 | 2,872.75 | 2,925.48 | (52.73) | (1.59)% | 12.90% | Bouncing off short-term support |
Source: Bloomberg and Sprott Asset Management LP. Data as of February 28, 2023.
*Mo % Chg and YTD % Chg for this Index are calculated as the difference between the month end’s yield and the previous period end’s yield, instead of the percentage change. Past performance is no guarantee of future results. You cannot invest directly in an index.
Guest post from Paul Wong at Sprott Inc.
Former CIA Officer Reveals Covert Tactics To Avoid Financial Ruin
Not Only Are We Facing Surging Inflation and a Crashing Market…
You ALSO Have to Watch Out for Thieves, Predatory Lawyers, and Government Money-Grabbers…
Get flush with cash, protect your 401k, retirement funds & investments.