
As I mentioned yesterday, the War in Iran has the potential to ignite another inflationary storm in the U.S.
We’ve already assessed the threat this conflict presents to energy prices. Today, I want to dive into the fact that the U.S. was already on the cusp of a second round of inflation BEFORE the War in Iran.
The headline inflation numbers have been trending down… but it’s critical to note that this trend is on a year-over-year basis. The reality is that prices in all segments of the Consumer Price Index except for Energy and Used Cars and Trucks continue higher. Put simply, the only reason inflation looks like it’s trending down is because prices are rising at a slower pace, not because prices are actually falling.
Indeed, when we dive into some of the other, less popular inflation metrics, it’s clear that inflation is not disappearing from the financial system. If anything, it was starting to rebound BEFORE the U.S. struck Iran.
The Institute for Supply Management (ISM) publishes two monthly surveys — one for manufacturing, one for services. Each includes a Prices Paid sub-index, which asks purchasing managers whether they’re paying more, less, or the same for inputs. A reading above 50 means prices are rising.
The readings for the ISM Manufacturing Prices Paid since December are:
- December: 58.5
- January: 59.0
- February: 70.5
The readings from the ISM Services Prices Paid surveys since December are:
- December: 65.4
- January: 66.6
- February: 63.0
Unlike the headline inflation numbers like the Consumer Price Index (CPI) or Personal Consumption Expenditures (PCE), these are real-world surveys taken from the frontlines of the economy without gimmicks. And they tell us that inflation was already surging BEFORE the U.S. struck Iran.
So what do you think will happen when energy prices remain elevated for a prolongued period as a result of the conflict in the Middle East?
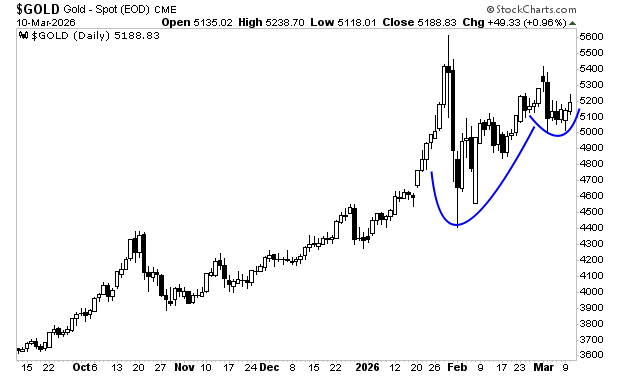
Gold has already figured it out…
On that note, our Special Investment Report titled Survive the Inflationary Storm details FIVE precious metals mining plays you can use to potentially make extraordinary gains. These are HIGH OCTANE positions that rose 75%, 140%, 150%, 180%, 280% and an incredible 574% in 2025! And I wouldn’t be surprised to see them repeat this performance in 2026.
Normally I’d charge $499 for this report as a standalone item, but in light of what is unfolding today, we are making just 100 copies available to the public.
To grab one of the last remaining copies…
Best Regards
Graham Summers
Chief Market Strategist
Phoenix Capital Research