
Written by Bryan Lutz, Editor at Dollarcollapse.com:
The story of the dollar’s slow exit from reserve-currency primacy gets told two ways.
One is loud, breathless, and wrong on the timing. The other is technical and right.
This story is part of the second one.
On Monday night, while the U.S. financial press was busy with hot CPI prints and AI funding rounds, the People’s Bank of China released a quarterly report most of the world ignored. Inside it was a number that, if you track the long substitution of the dollar in international trade settlement, lands like a small bell.
Central banks worldwide had drawn 111.6 billion yuan from the PBOC’s foreign-exchange swap lines by the end of March. That’s roughly $16.4 billion, the highest balance since March 2024, and a 17.4 billion yuan jump from the previous quarter. The quarter-over-quarter jump itself is the steepest in three years.
Bloomberg reported the print on Tuesday morning. Nobody else did.
Bloomberg reports:
Central Banks Tap Most Yuan Swap Lines With PBOC in Two Years
Global central banks’ use of the People’s Bank of China’s swap lines reached a two-year high in the first quarter, underscoring rising international demand for the Chinese currency. By the end of March, central banks worldwide had drawn a total of 111.6 billion yuan ($16.4 billion) from the PBOC’s foreign-exchange swap lines, the highest level since March 2024, according to the Chinese central bank’s quarterly report released late Monday. The 17.4 billion yuan increase from the previous three-month period marked the steepest quarter-on-quarter rise since 2023, Bloomberg calculations show.
A currency swap line is plumbing. When a swap drawdown rises, more international clearing is happening in the swap’s source currency. That’s how reserve-currency status is measured: by who is using the currency, not by who declares it dominant. 111.6 billion yuan drawn instead of the dollar equivalent is substitution at the margin, and substitution at the margin is how reserve currencies lose status.
Here’s the picture in one chart:
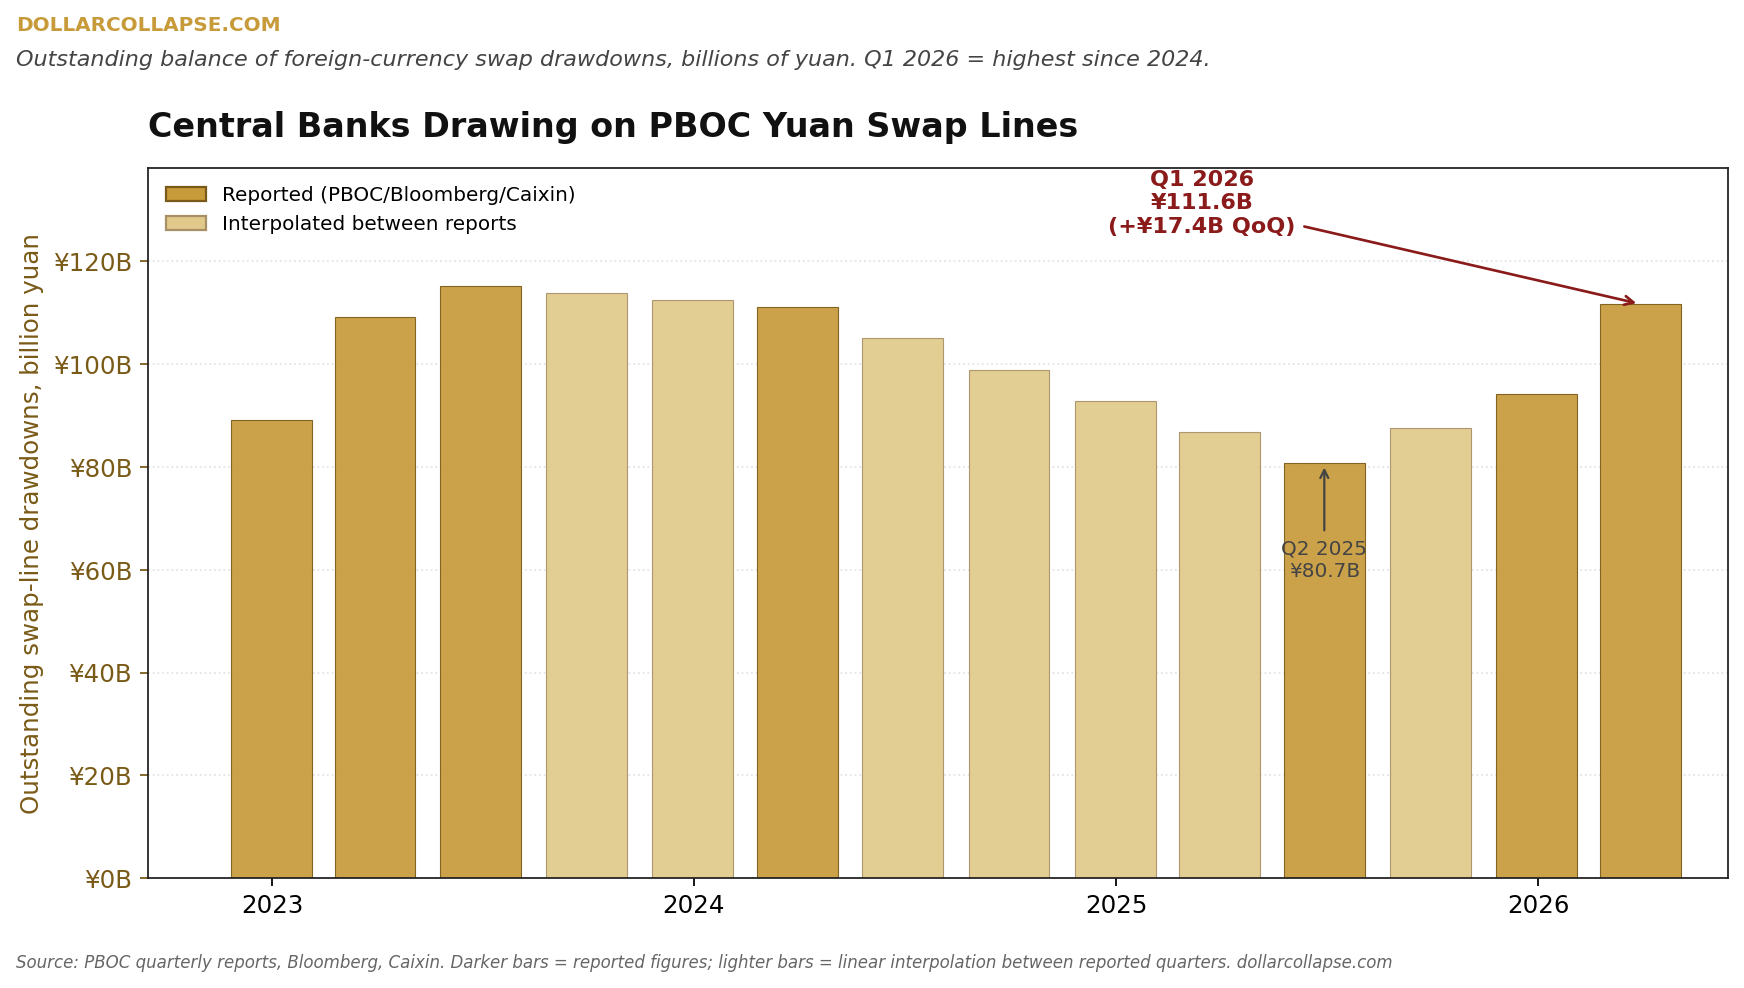
The darker bars are the figures published by the PBOC, Bloomberg, and Caixin directly. The lighter bars are linear interpolations between them. Drawdowns fell through most of 2024 and 2025, then jumped 17.4 billion yuan in three months.
You can see the results of the Iran War.
Asia Times reports:
Trump-Xi meet as petroyuan rises on Iran war’s tide
During the hostilities, Iran began conditioning safe passage for oil tankers through the Strait of Hormuz on payments made in Chinese yuan, effectively weaponizing the currency to break the dollar’s monopoly. This tactical move has structural implications for oil trading. With Saudi Arabia now selling four times as much oil to China as to the US, the logic of settling those massive transactions in dollars is increasingly tenuous.
The yuan was used as the toll currency on the world’s most strategically important oil chokepoint, in transactions the dollar has owned for half a century. And when it comes to Saudi Arabia, the original petrodollar partner, now sells four times more oil to China than to the United States. The customer base for petrodollar settlement was always the inertia holding the system together, and that inertia is breaking.
That makes Trump’s meeting with Xi in Beijing less about a head-to-head competition and more about the undercurrents of political realignment. China now views the United States as an empire in decline. Once that narrative permission moves into mainstream print, the data points you see above won’t be surprises.
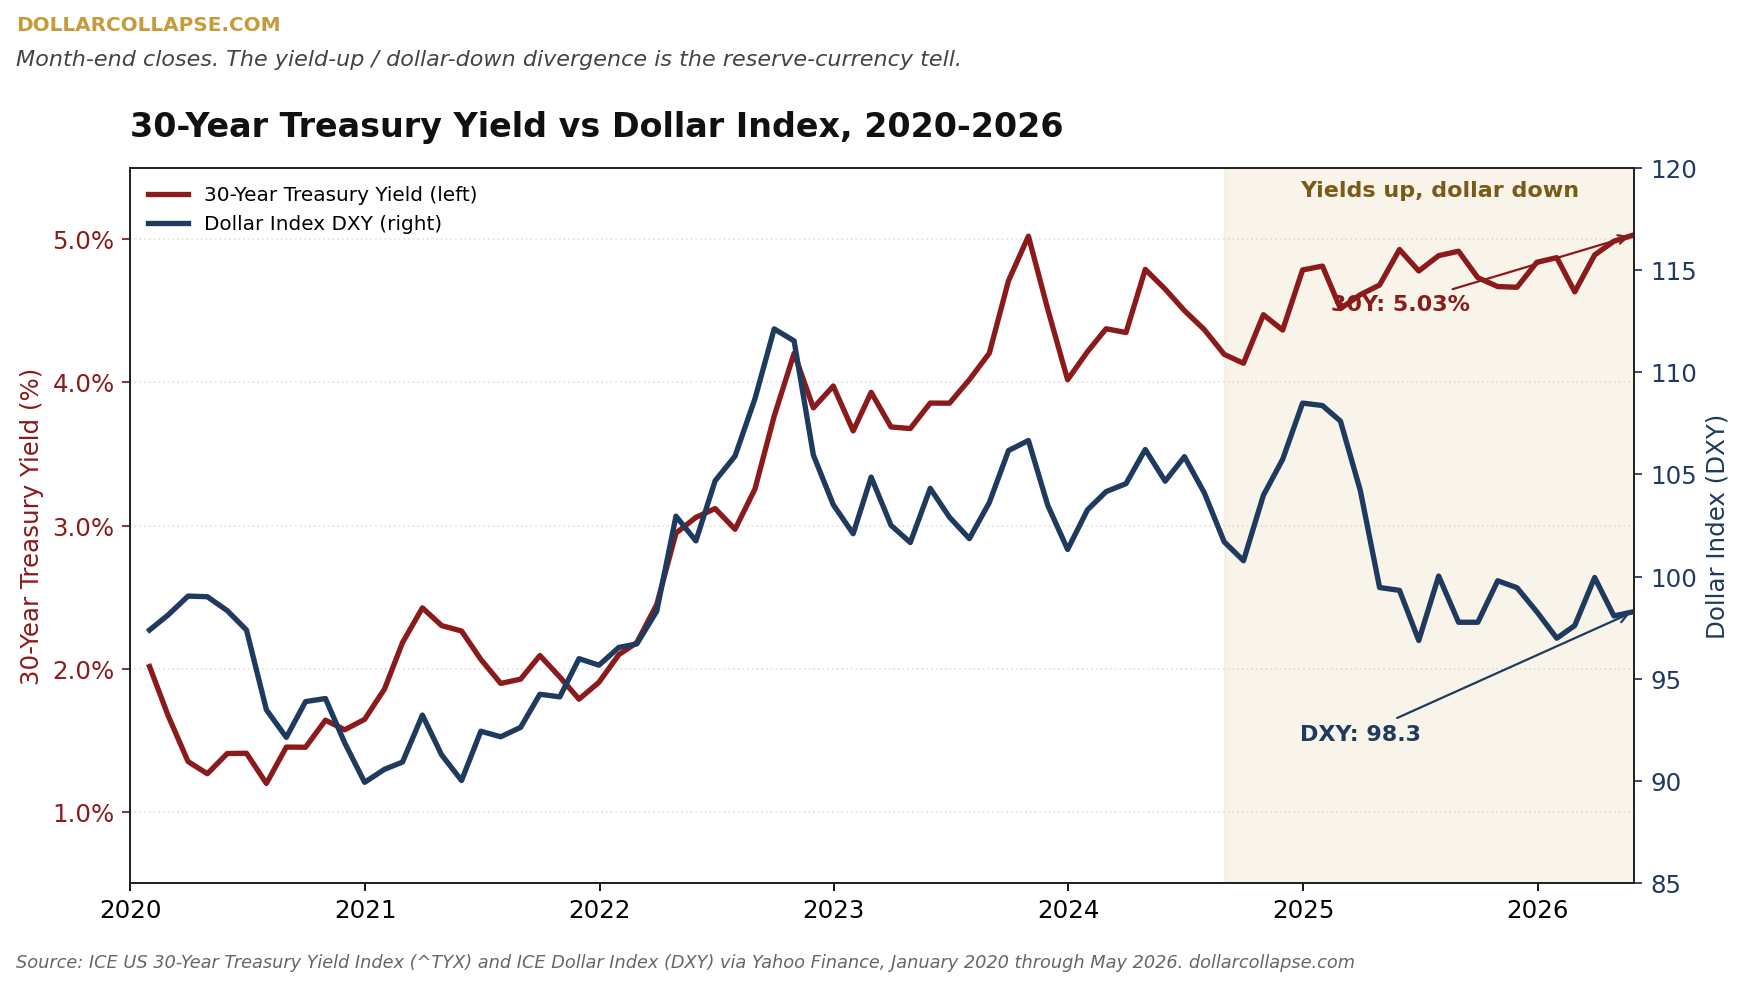
The US Treasury bond market shows the decline. The 30-year U.S. Treasury yield closed yesterday at 5.03%. The dollar index is at 98. Higher yields are supposed to attract foreign capital into dollar assets, but yields have been climbing for eighteen months while the dollar index has been softening. Historically, they two move together, but not since the Fed raised interest rates in 2022.
Reserve currencies don’t collapse. They get substituted. The UK’s Pound-Sterling held the formal title until the 1944 Bretton Woods conference, but the mechanical loss had started in 1914. Thirty years of drift, one conference to make it official.
The dollar’s substitution has been measurable since at least 2014, when BRICS gold and currency-swap arrangements started accelerating. For the past twelve years there’s been mechanical drift in the global monetary system, away from the USD. The Q1 2026 swap-line print is one more data point in a long series. It’s not a tipping point, not yet. I’m not predict the tipping date either, but I am pointing out what the substitution looks like while it’s happening.
It looks like this, for example:
111.6 billion yuan in a PBOC quarterly report.
Central banks buying 244 tons of gold in Q1 while the price was pulling back.
In every recorded reserve-currency transition in history, gold.
The substitution is happening at a measurable rate, and the people closest to the data are buying real assets without fanfare and in size.
Investors who pay attention to swap-line prints and central-bank gold purchases tend to do well in transitions like this.